
MOVE Hits 108: The Collateral Channel Activates
Bond volatility surges 20 points in a week. The mechanism this report has been tracking is now actively tightening financial conditions.

Weekly analysis of global liquidity, Bitcoin, gold, and silver. Published every Sunday.
1: The Pulse
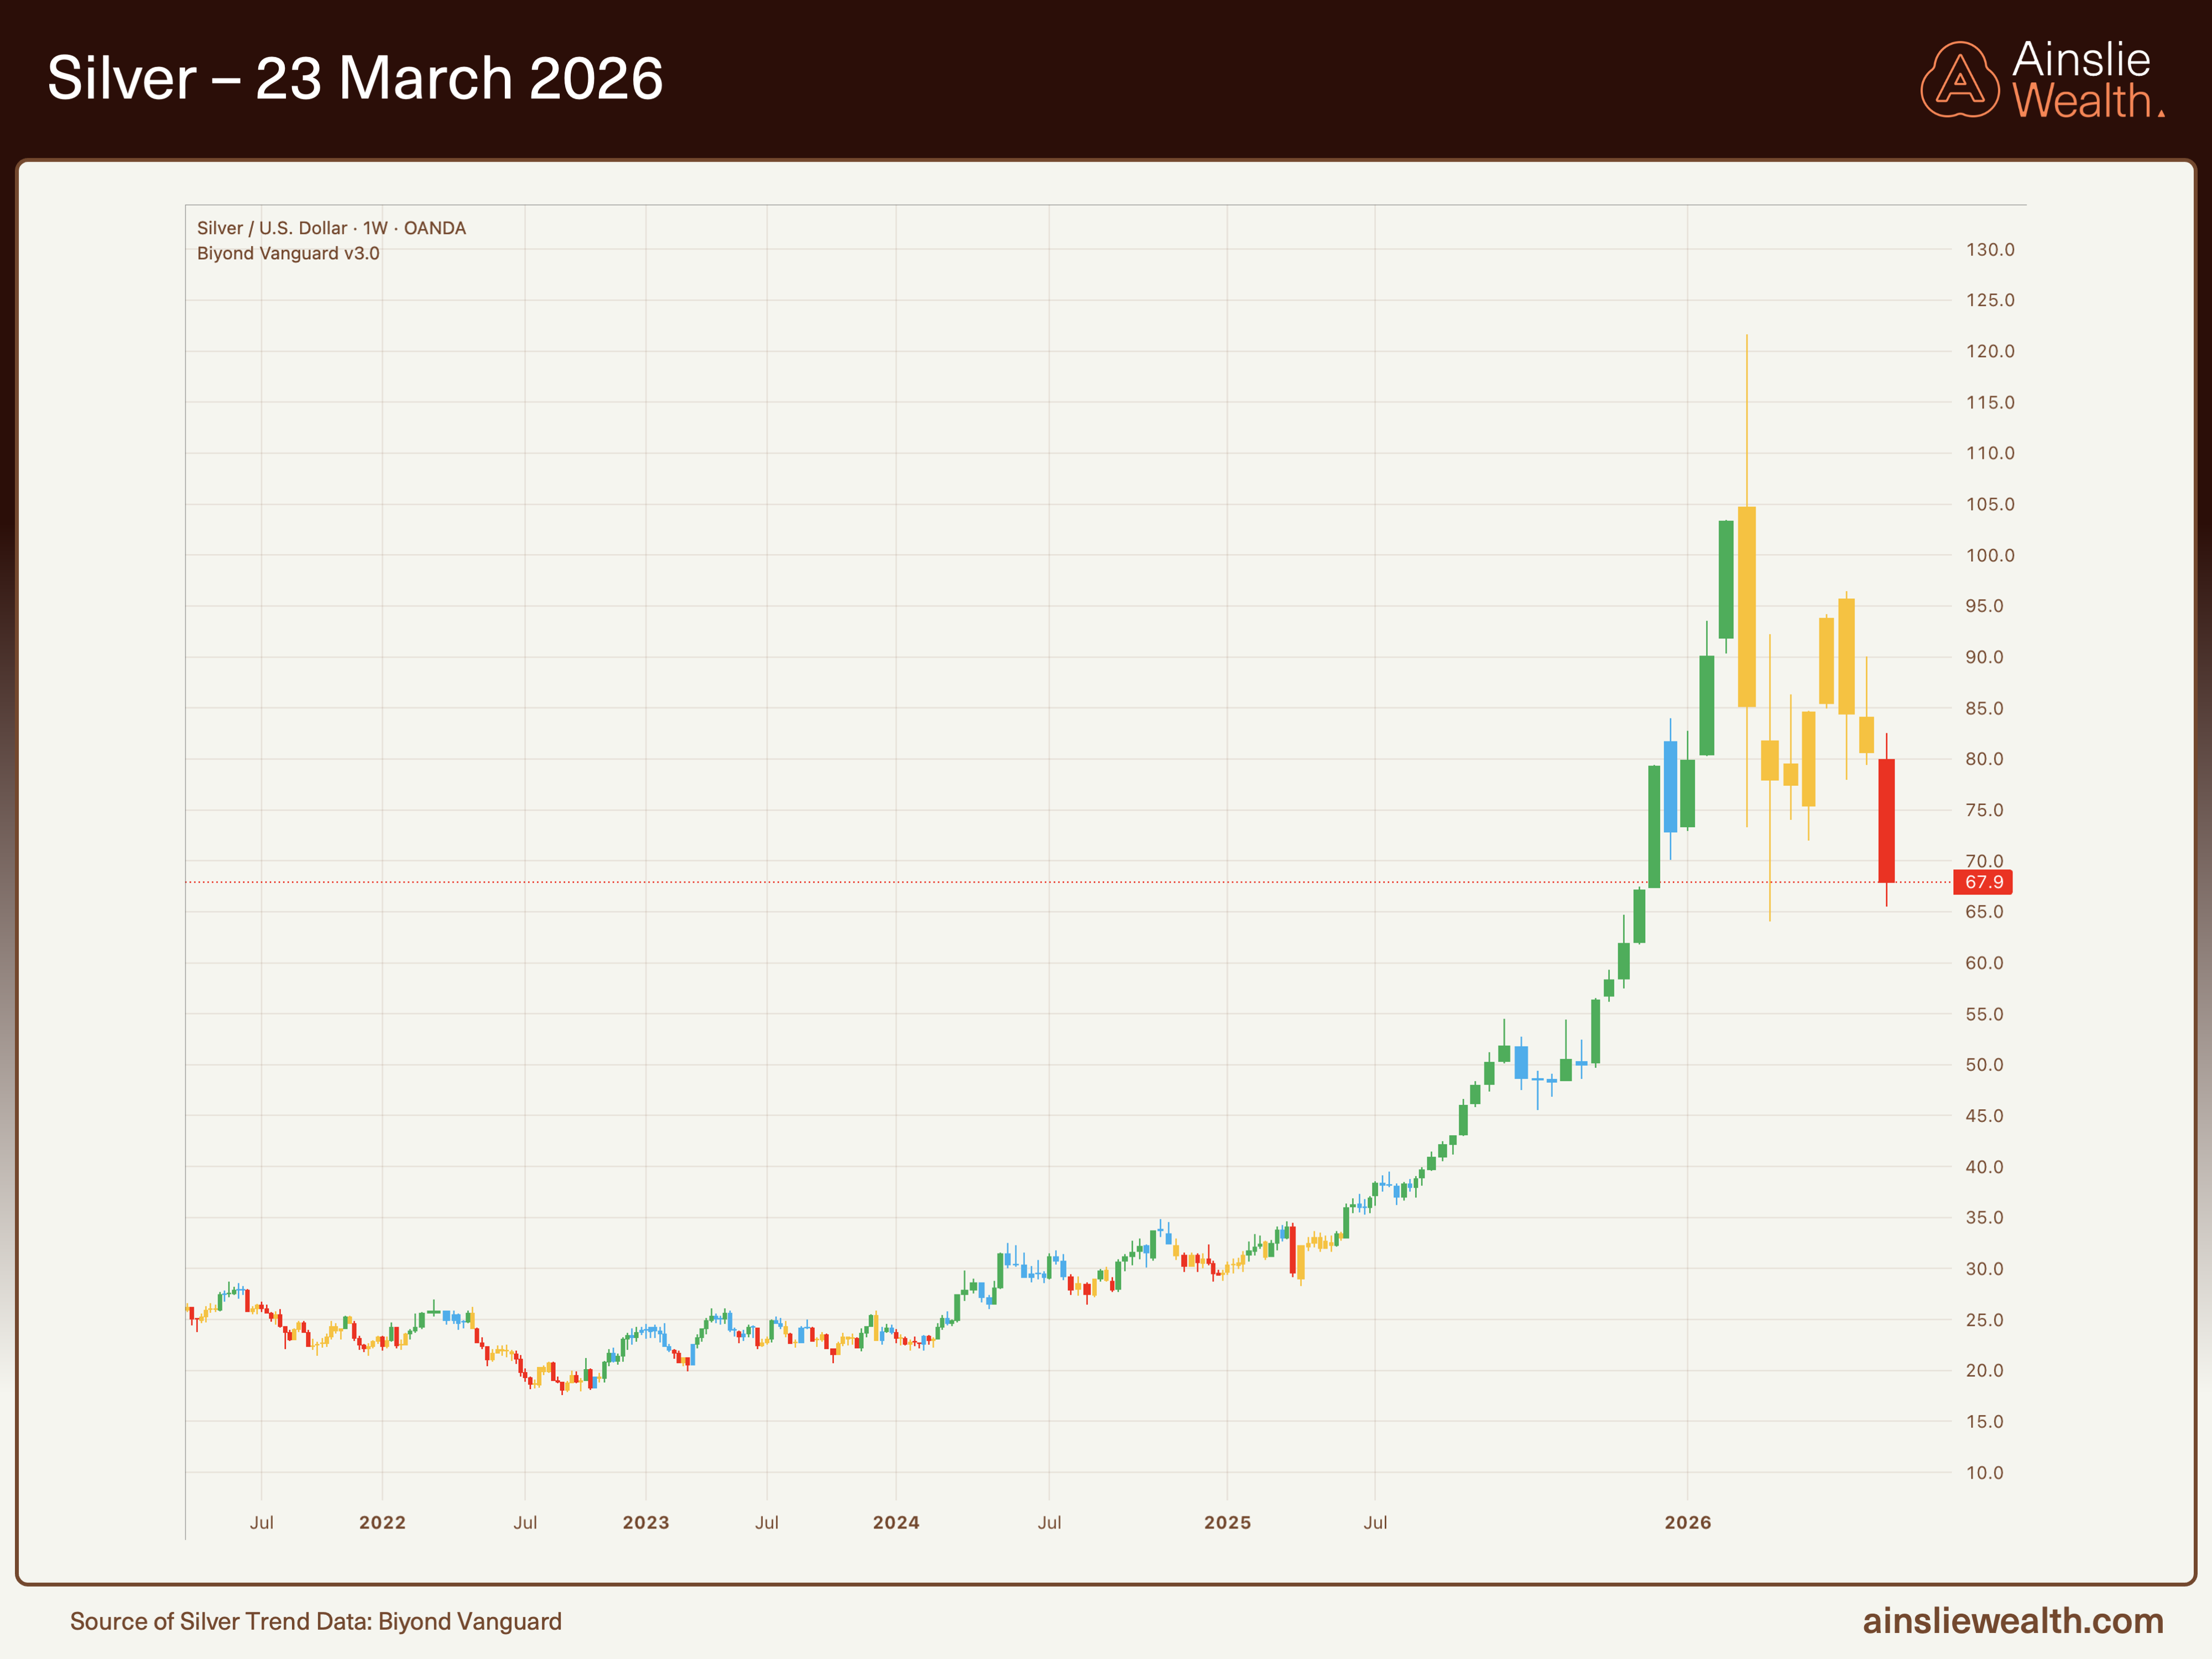
Bitcoin trades at $68,804, gold at $4,497, silver at $67.90. The Bitcoin/gold ratio has ticked up to 15.3, a marginal improvement from last week’s 14.1. The gold/silver ratio has risen to 66.2 from 62.28, reflecting silver’s sharper correction.
The story this week is not in the direction of these prices but in their magnitude. Gold dropped over 10% from $5,021. Silver fell nearly 16% from $80.60. Bitcoin, often the most volatile of the three, was the steadiest, declining just 2.7%. The precious metals pulled back sharply from recent highs, but both remain dramatically elevated from where they started 2025. Gold’s pullback from $5,600 to $4,497 is a correction within a structural uptrend that has run from $1,700. Silver’s retreat from its $125 spike to $67.90 looks violent in isolation but is consolidation after a parabolic move from the mid-$30s.
Bitcoin’s relative stability is notable. The asset has already repriced from $125,000 to the high $60s over several months. Gold and silver are now catching up to the kind of volatility Bitcoin experienced earlier in the cycle. The structural divergence persists: assets that function without trust continue to outperform those that depend on it, but corrections within that outperformance are normal and healthy.
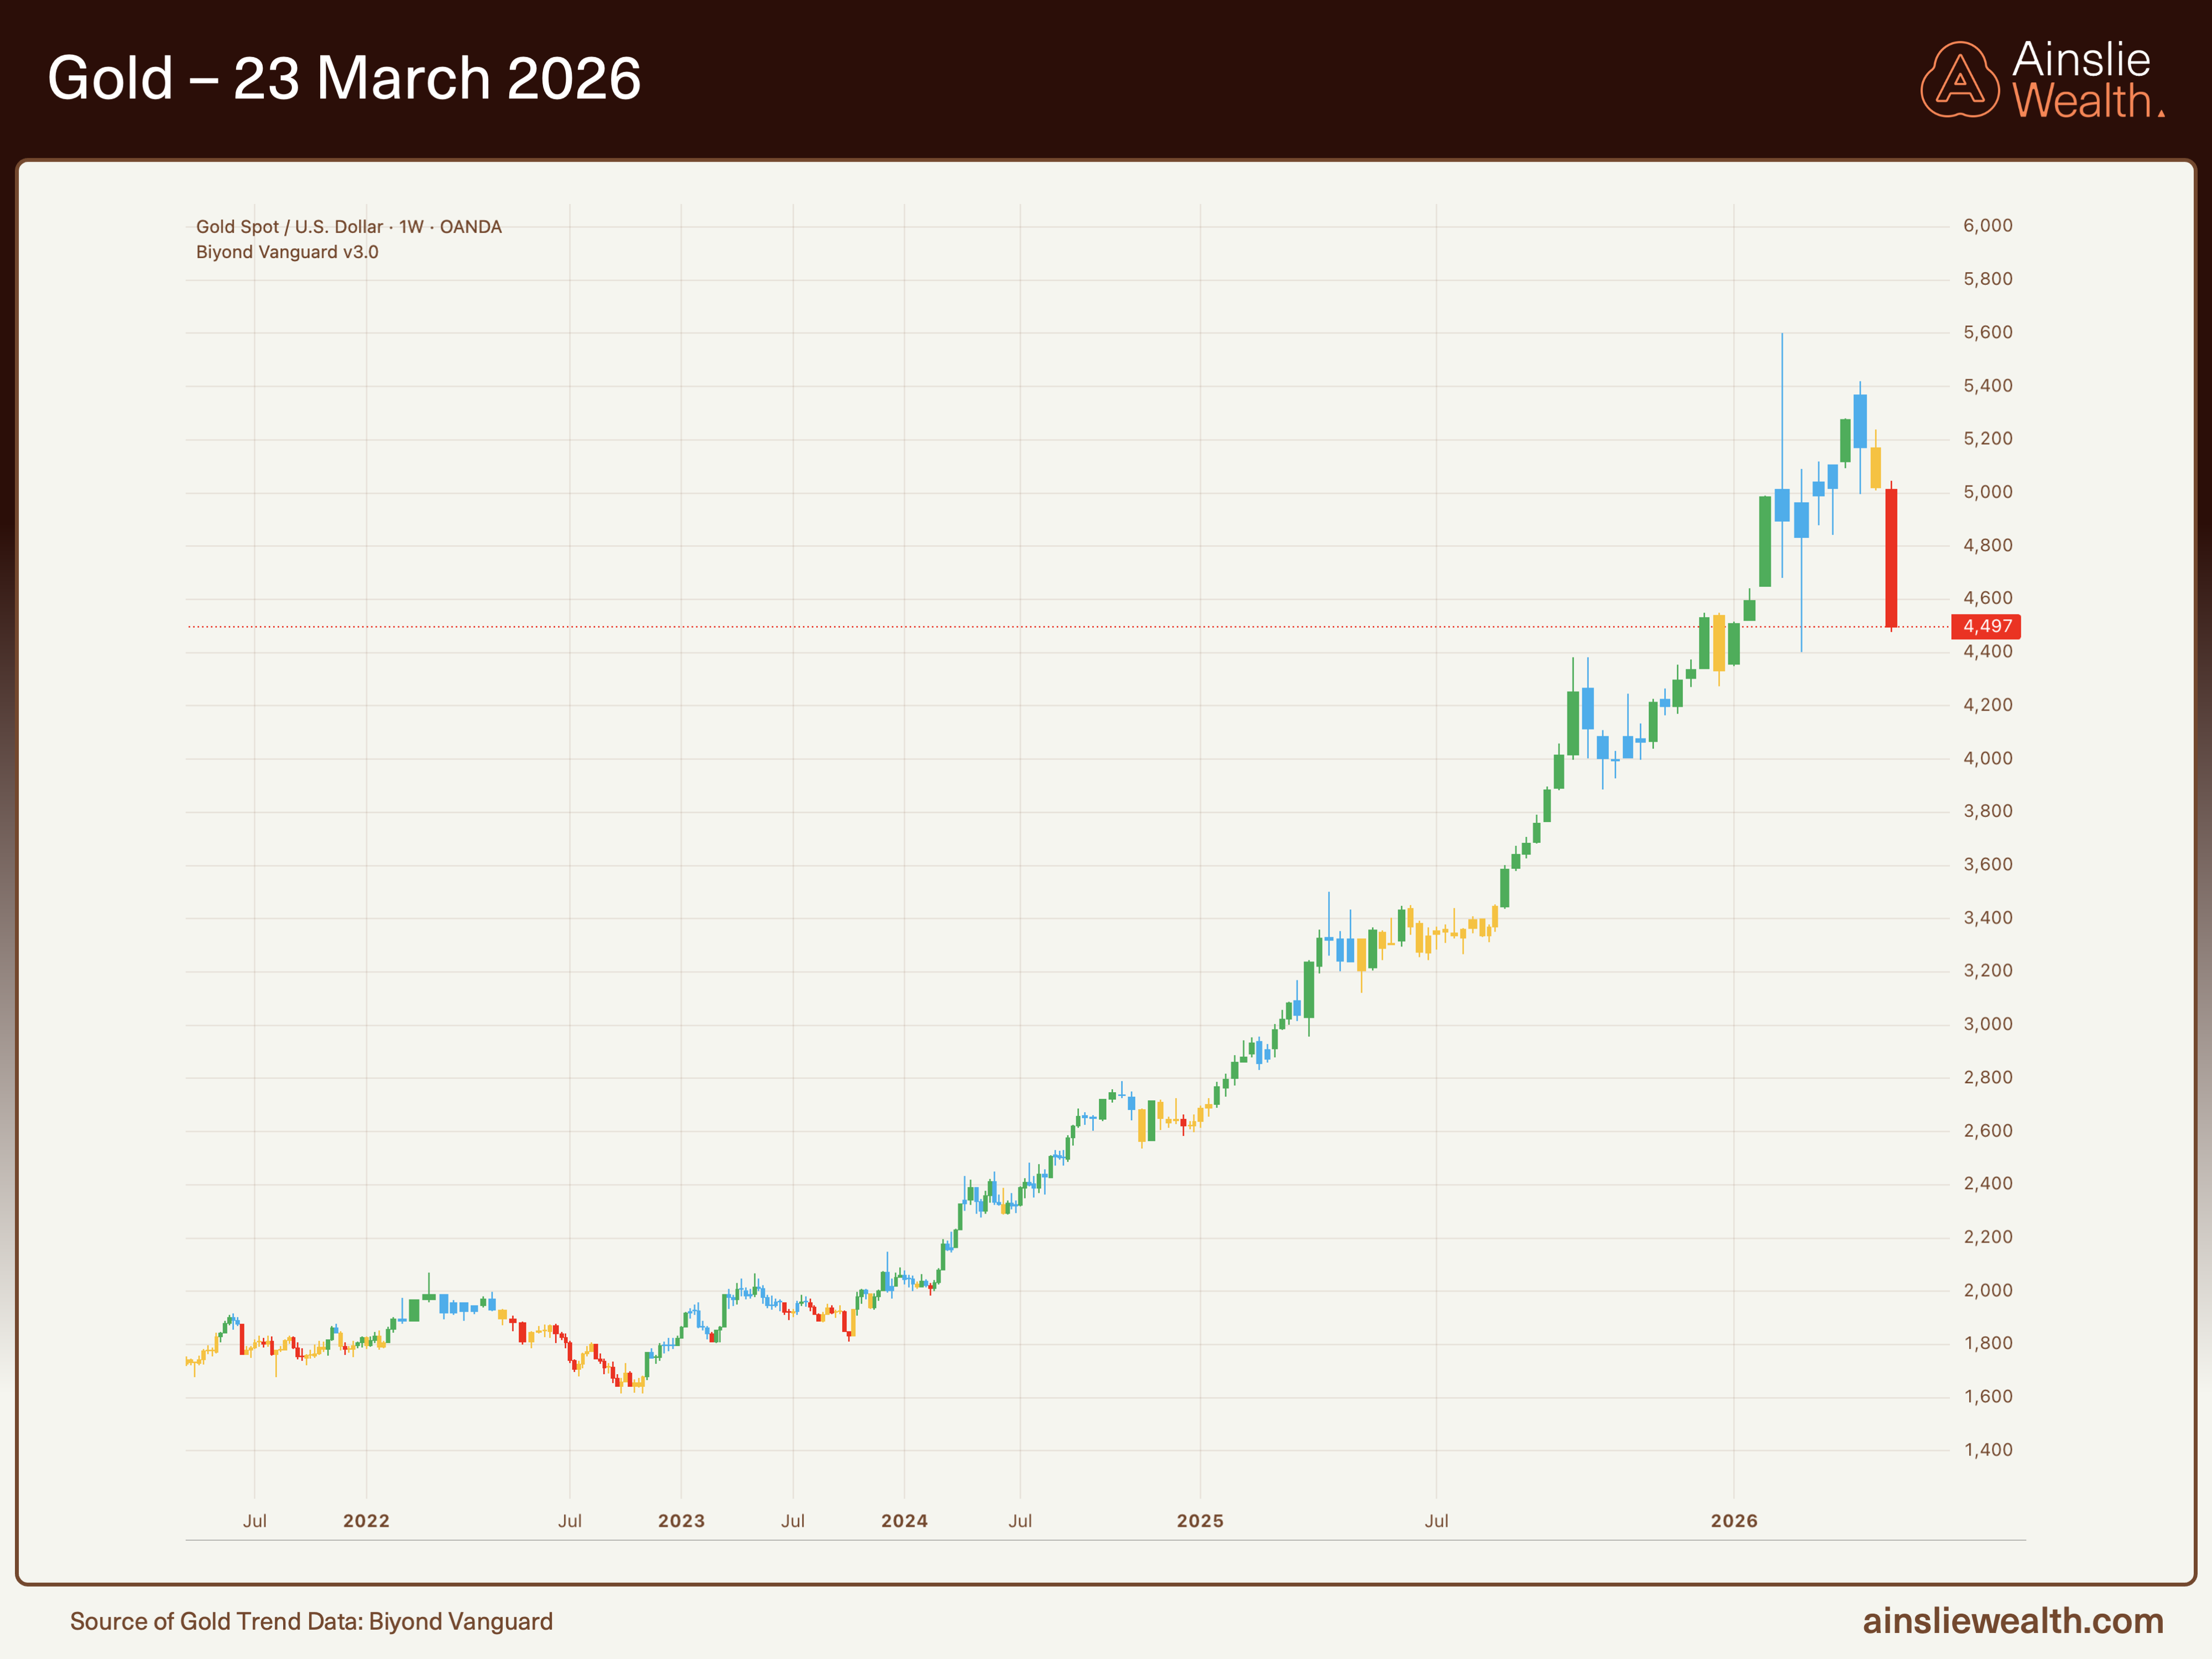
Gold at $4,497: a sharp correction from the $5,600 high, but the structural uptrend from $1,700 remains intact.
Silver at $67.90: retreating from its $125 spike. The correction is dramatic but the move from $30 to here is the structure that matters.
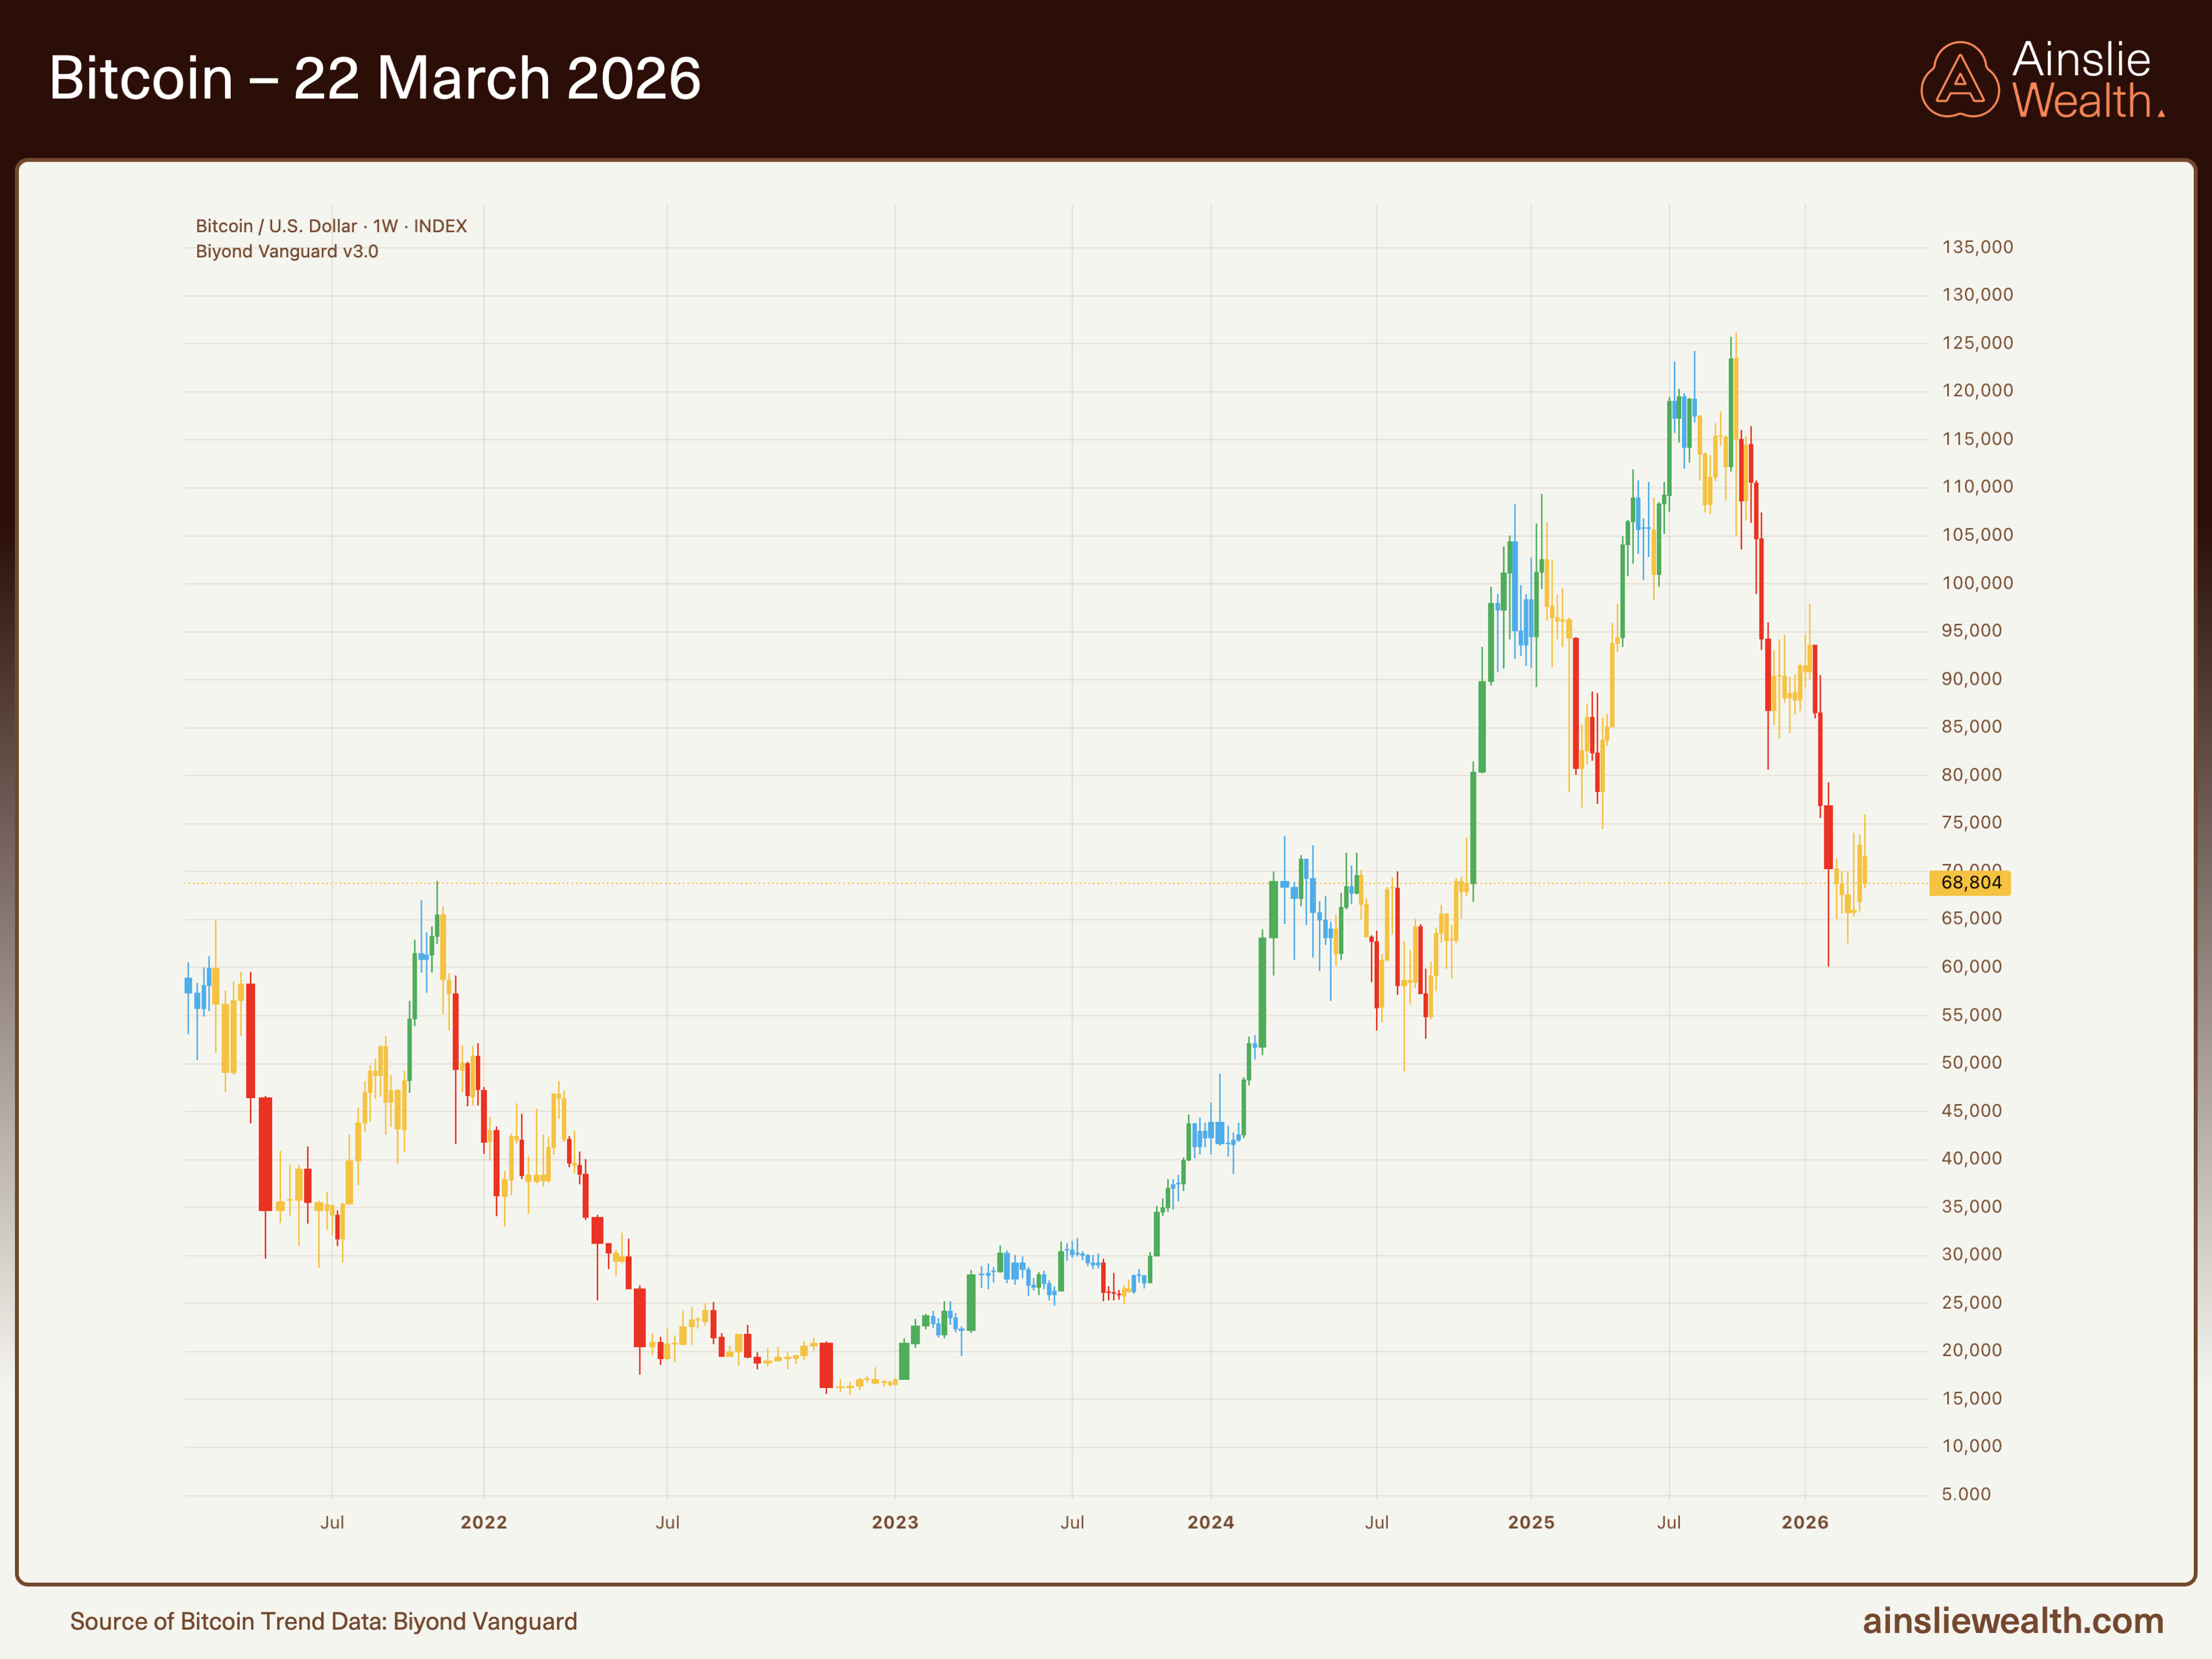
Bitcoin at $68,804: relatively stable this week while precious metals corrected. The liquidity-driven drawdown from $125,000 continues to consolidate.
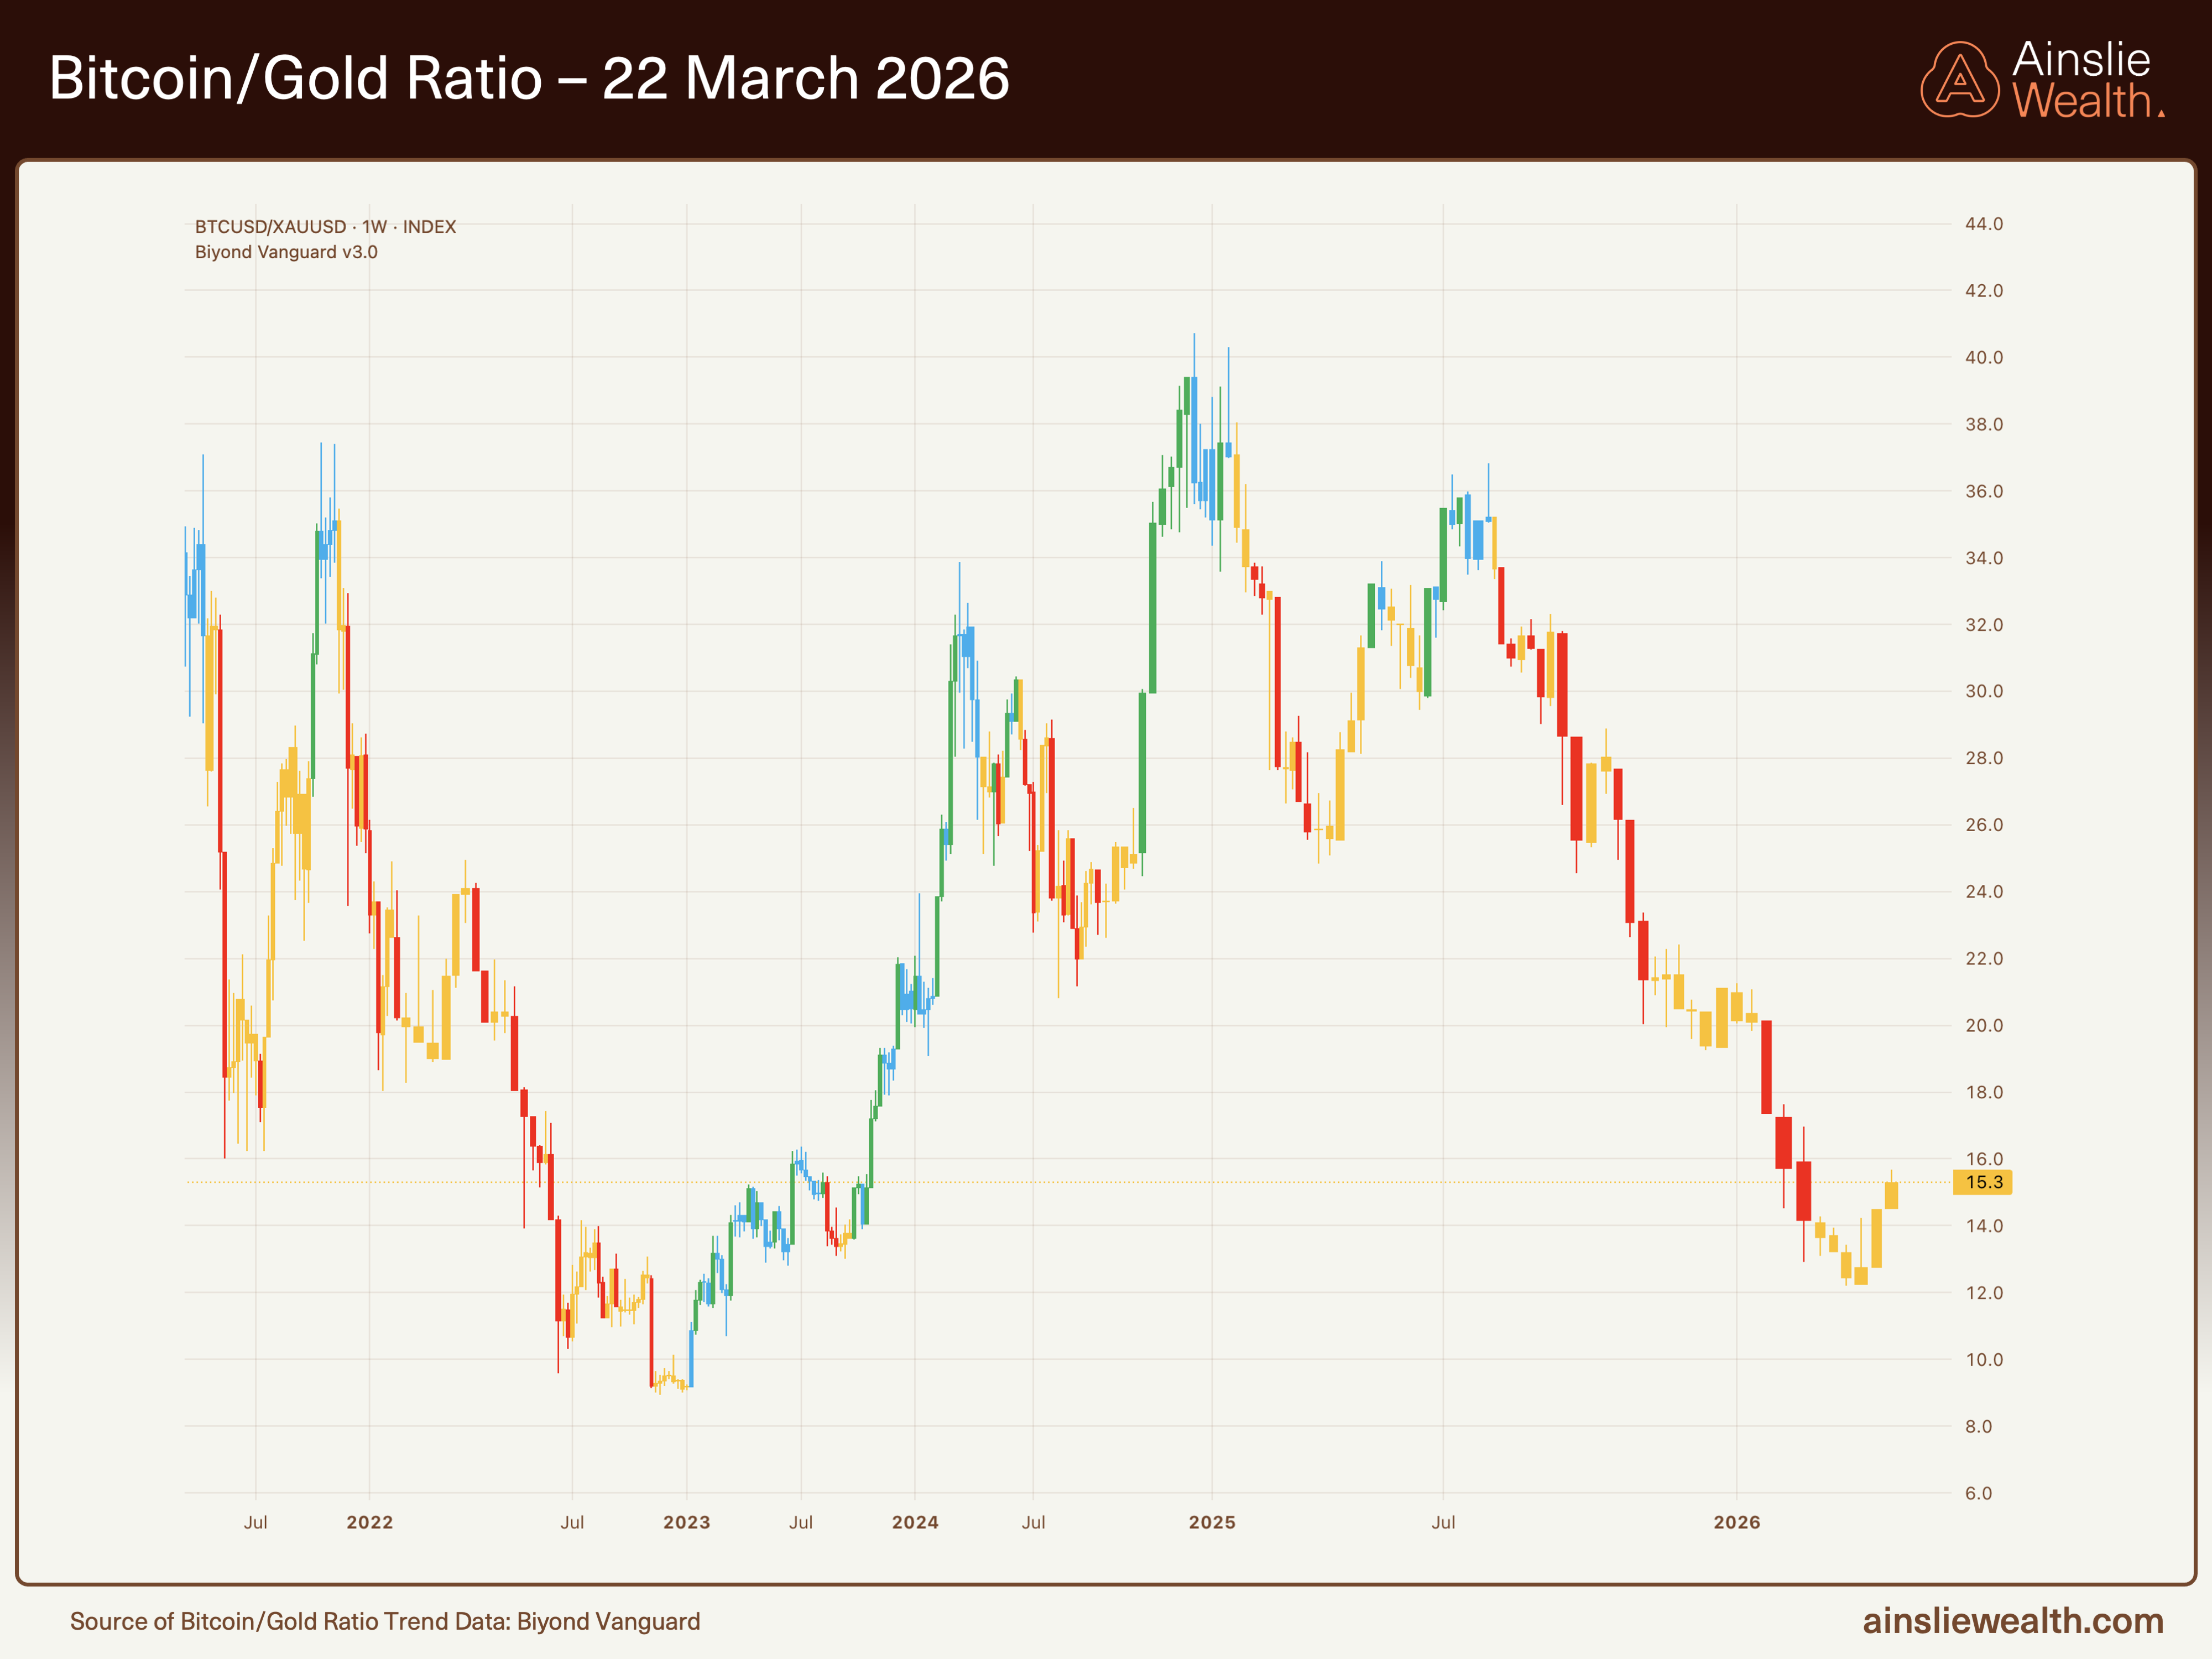
BTC/Gold ratio at 15.3: a slight improvement as gold corrected harder than Bitcoin this week.
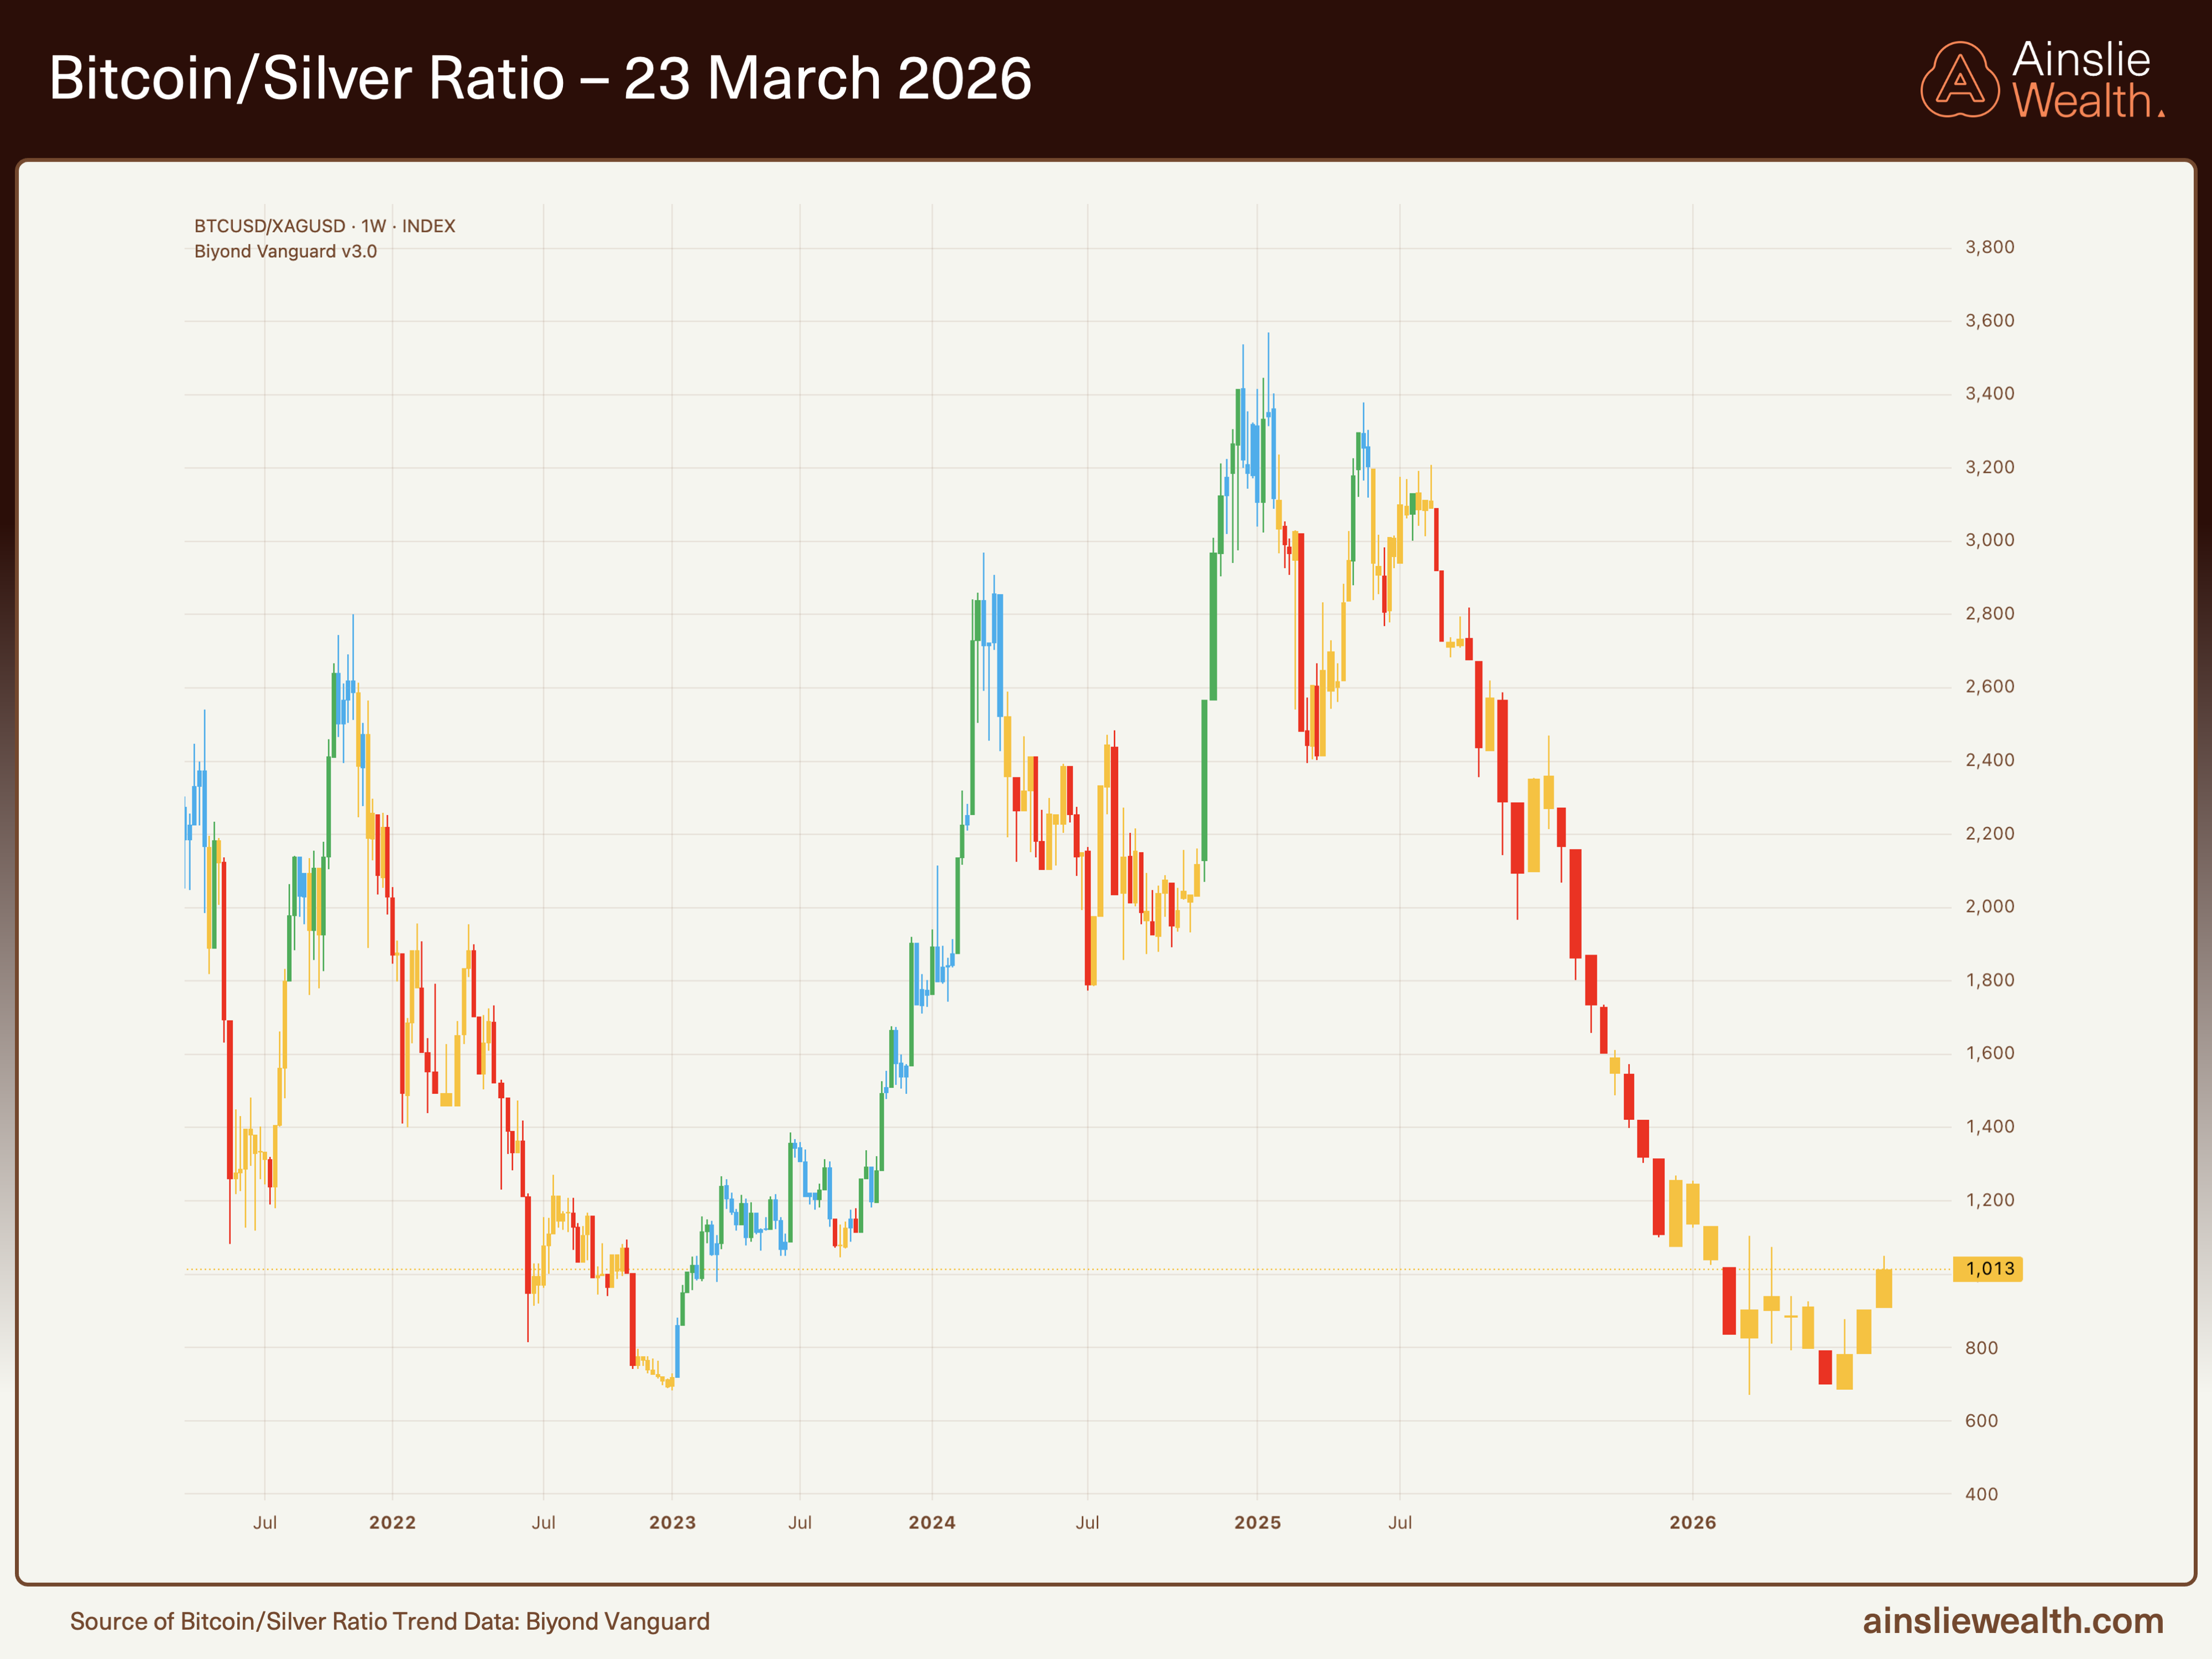
BTC/Silver ratio at 1,013: bouncing from the ~600 low as silver’s sharper correction improves BTC’s relative position.
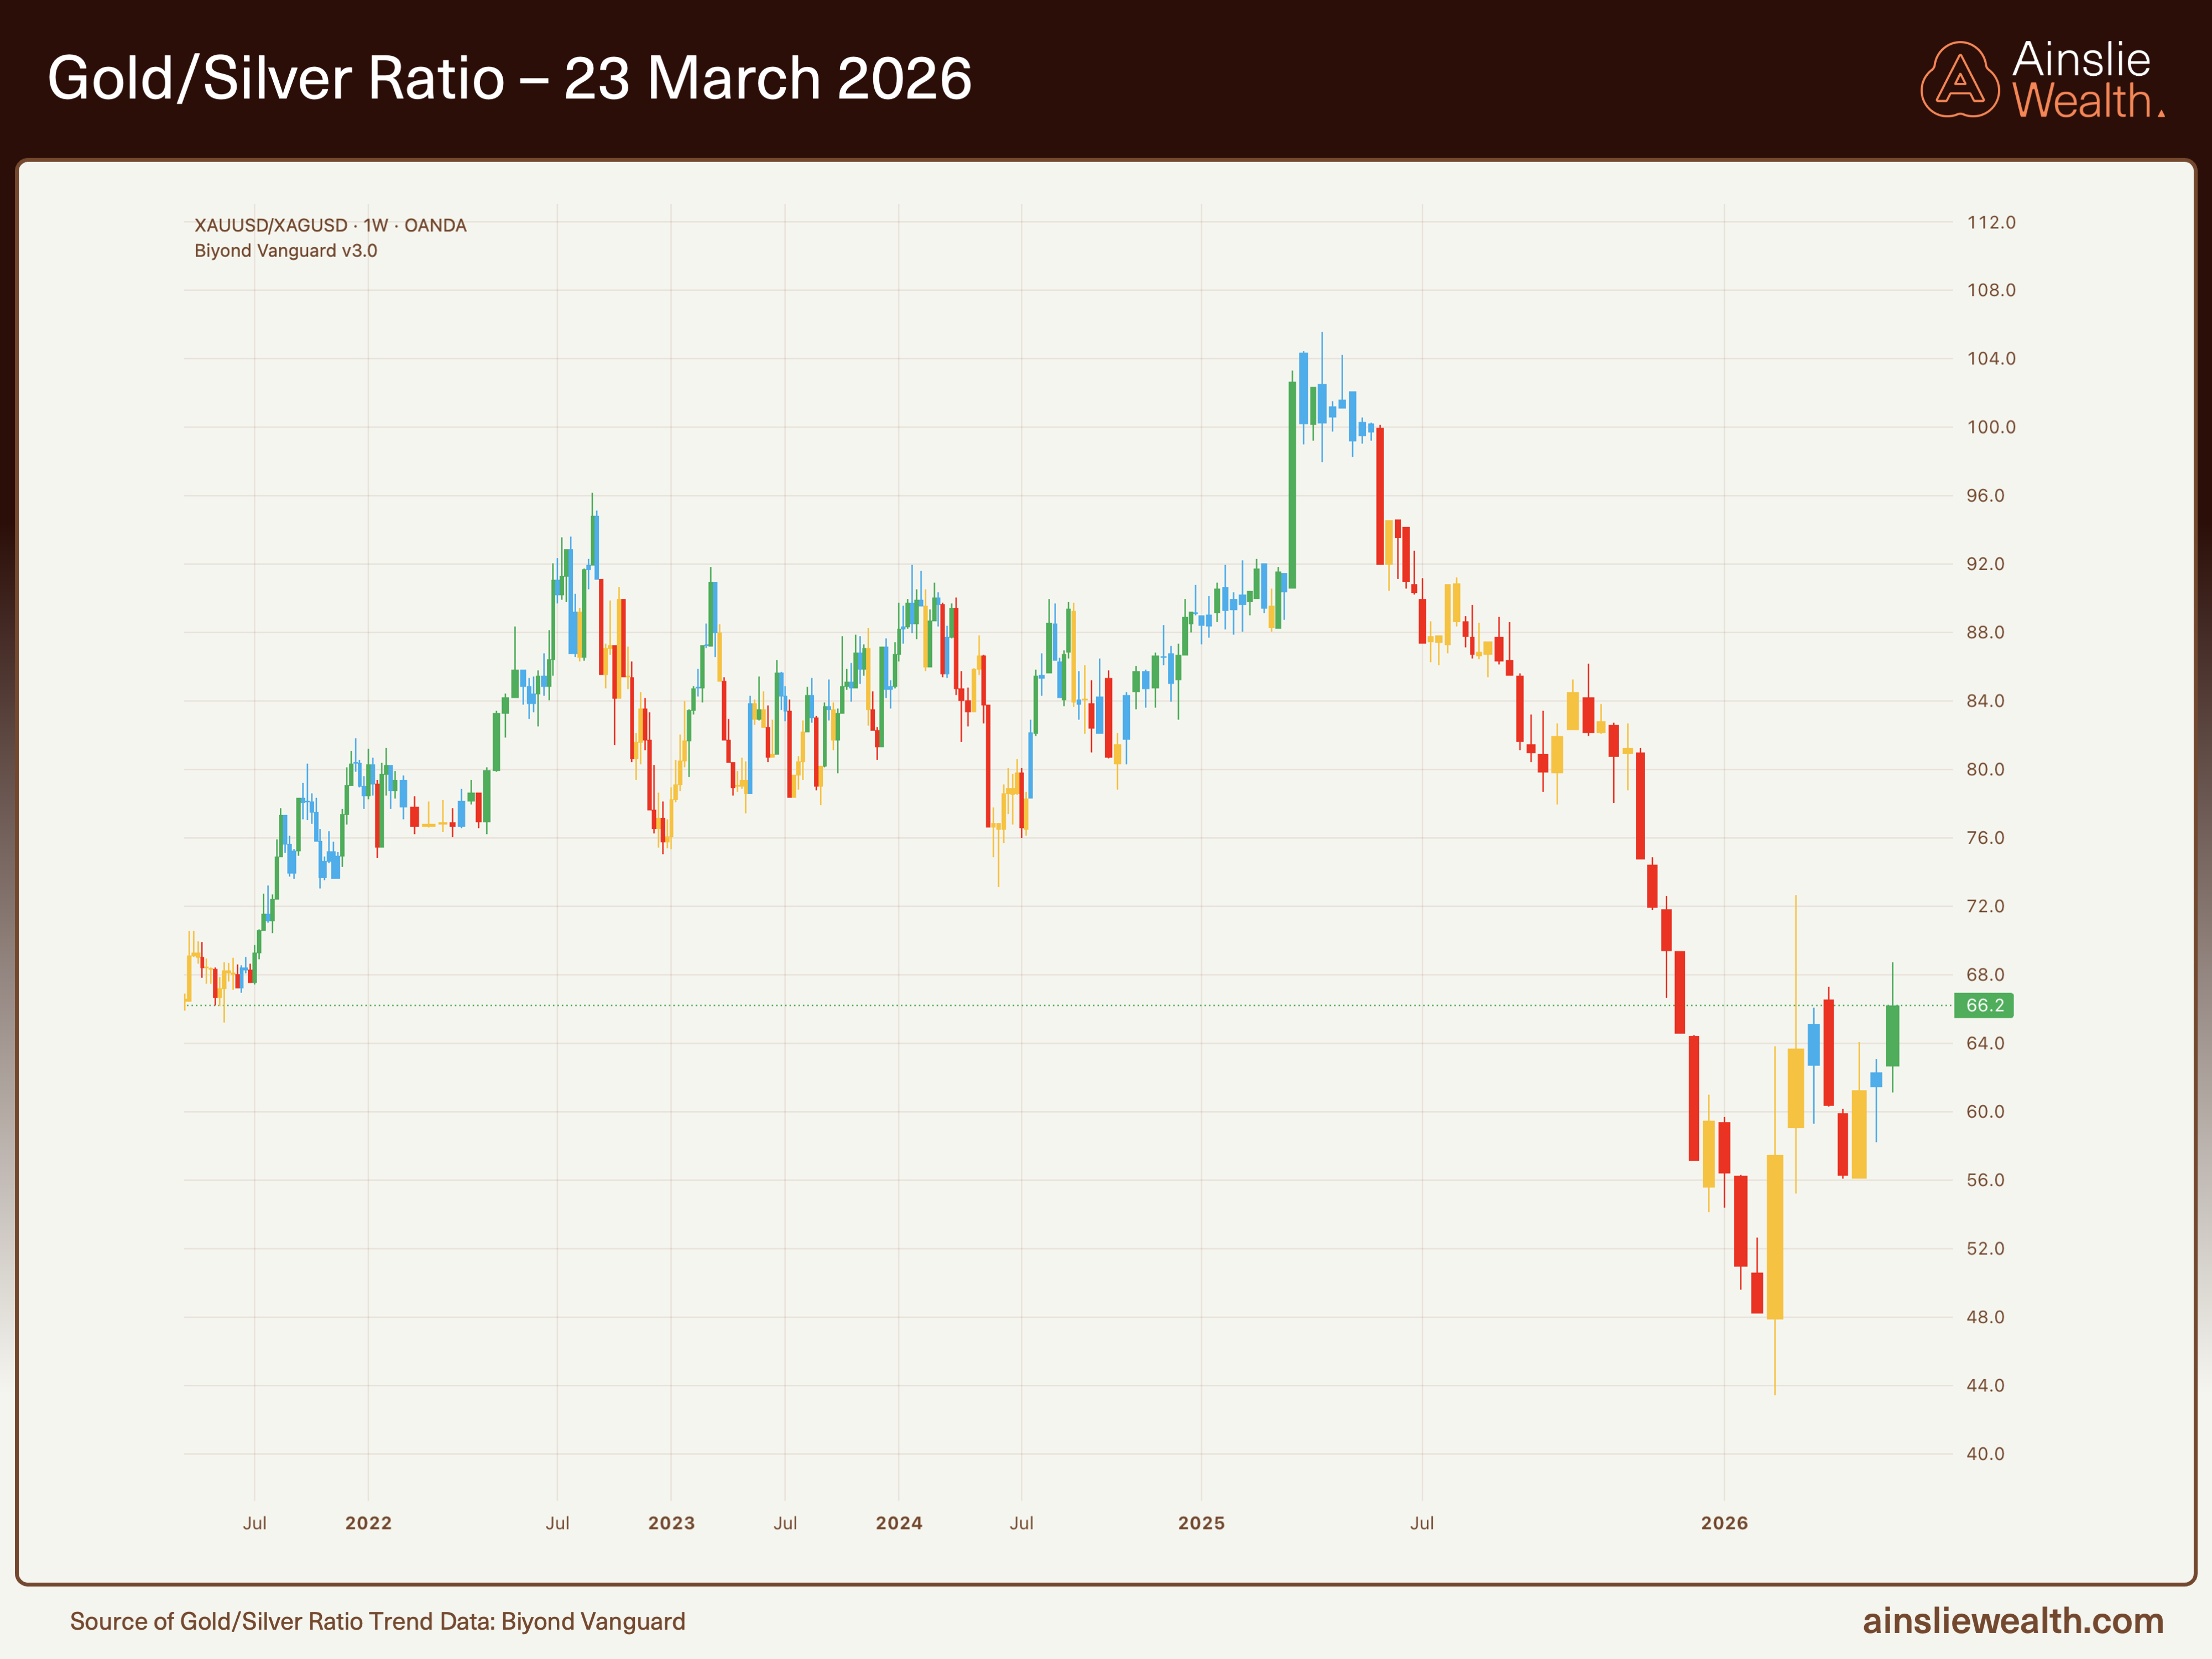
Gold/Silver ratio at 66.2: rising from 62.28 as silver’s correction outpaces gold’s. The ratio approaches the 100-year average of 56.62 from above.
2: Liquidity Conditions
The Global Liquidity Index remains at 43.8, firmly below the 50 expansion threshold. The GLI is updated monthly, so this reading is unchanged from last week. Nominal global liquidity, however, has eased from its recent peak of approximately $189 trillion to around $187.5 trillion.
This is a meaningful development. For months, the thesis has rested on a simple framework: the nominal pool holds near record highs (floor) while the rate of change decelerates (no impulse). This week, even the floor has begun to soften. The ~$1.5 trillion pullback is modest in percentage terms, but the direction matters. If the nominal level begins to decline alongside the already-contracting GLI, the framework shifts from floor-without-impulse to something more restrictive: a declining floor with no impulse.
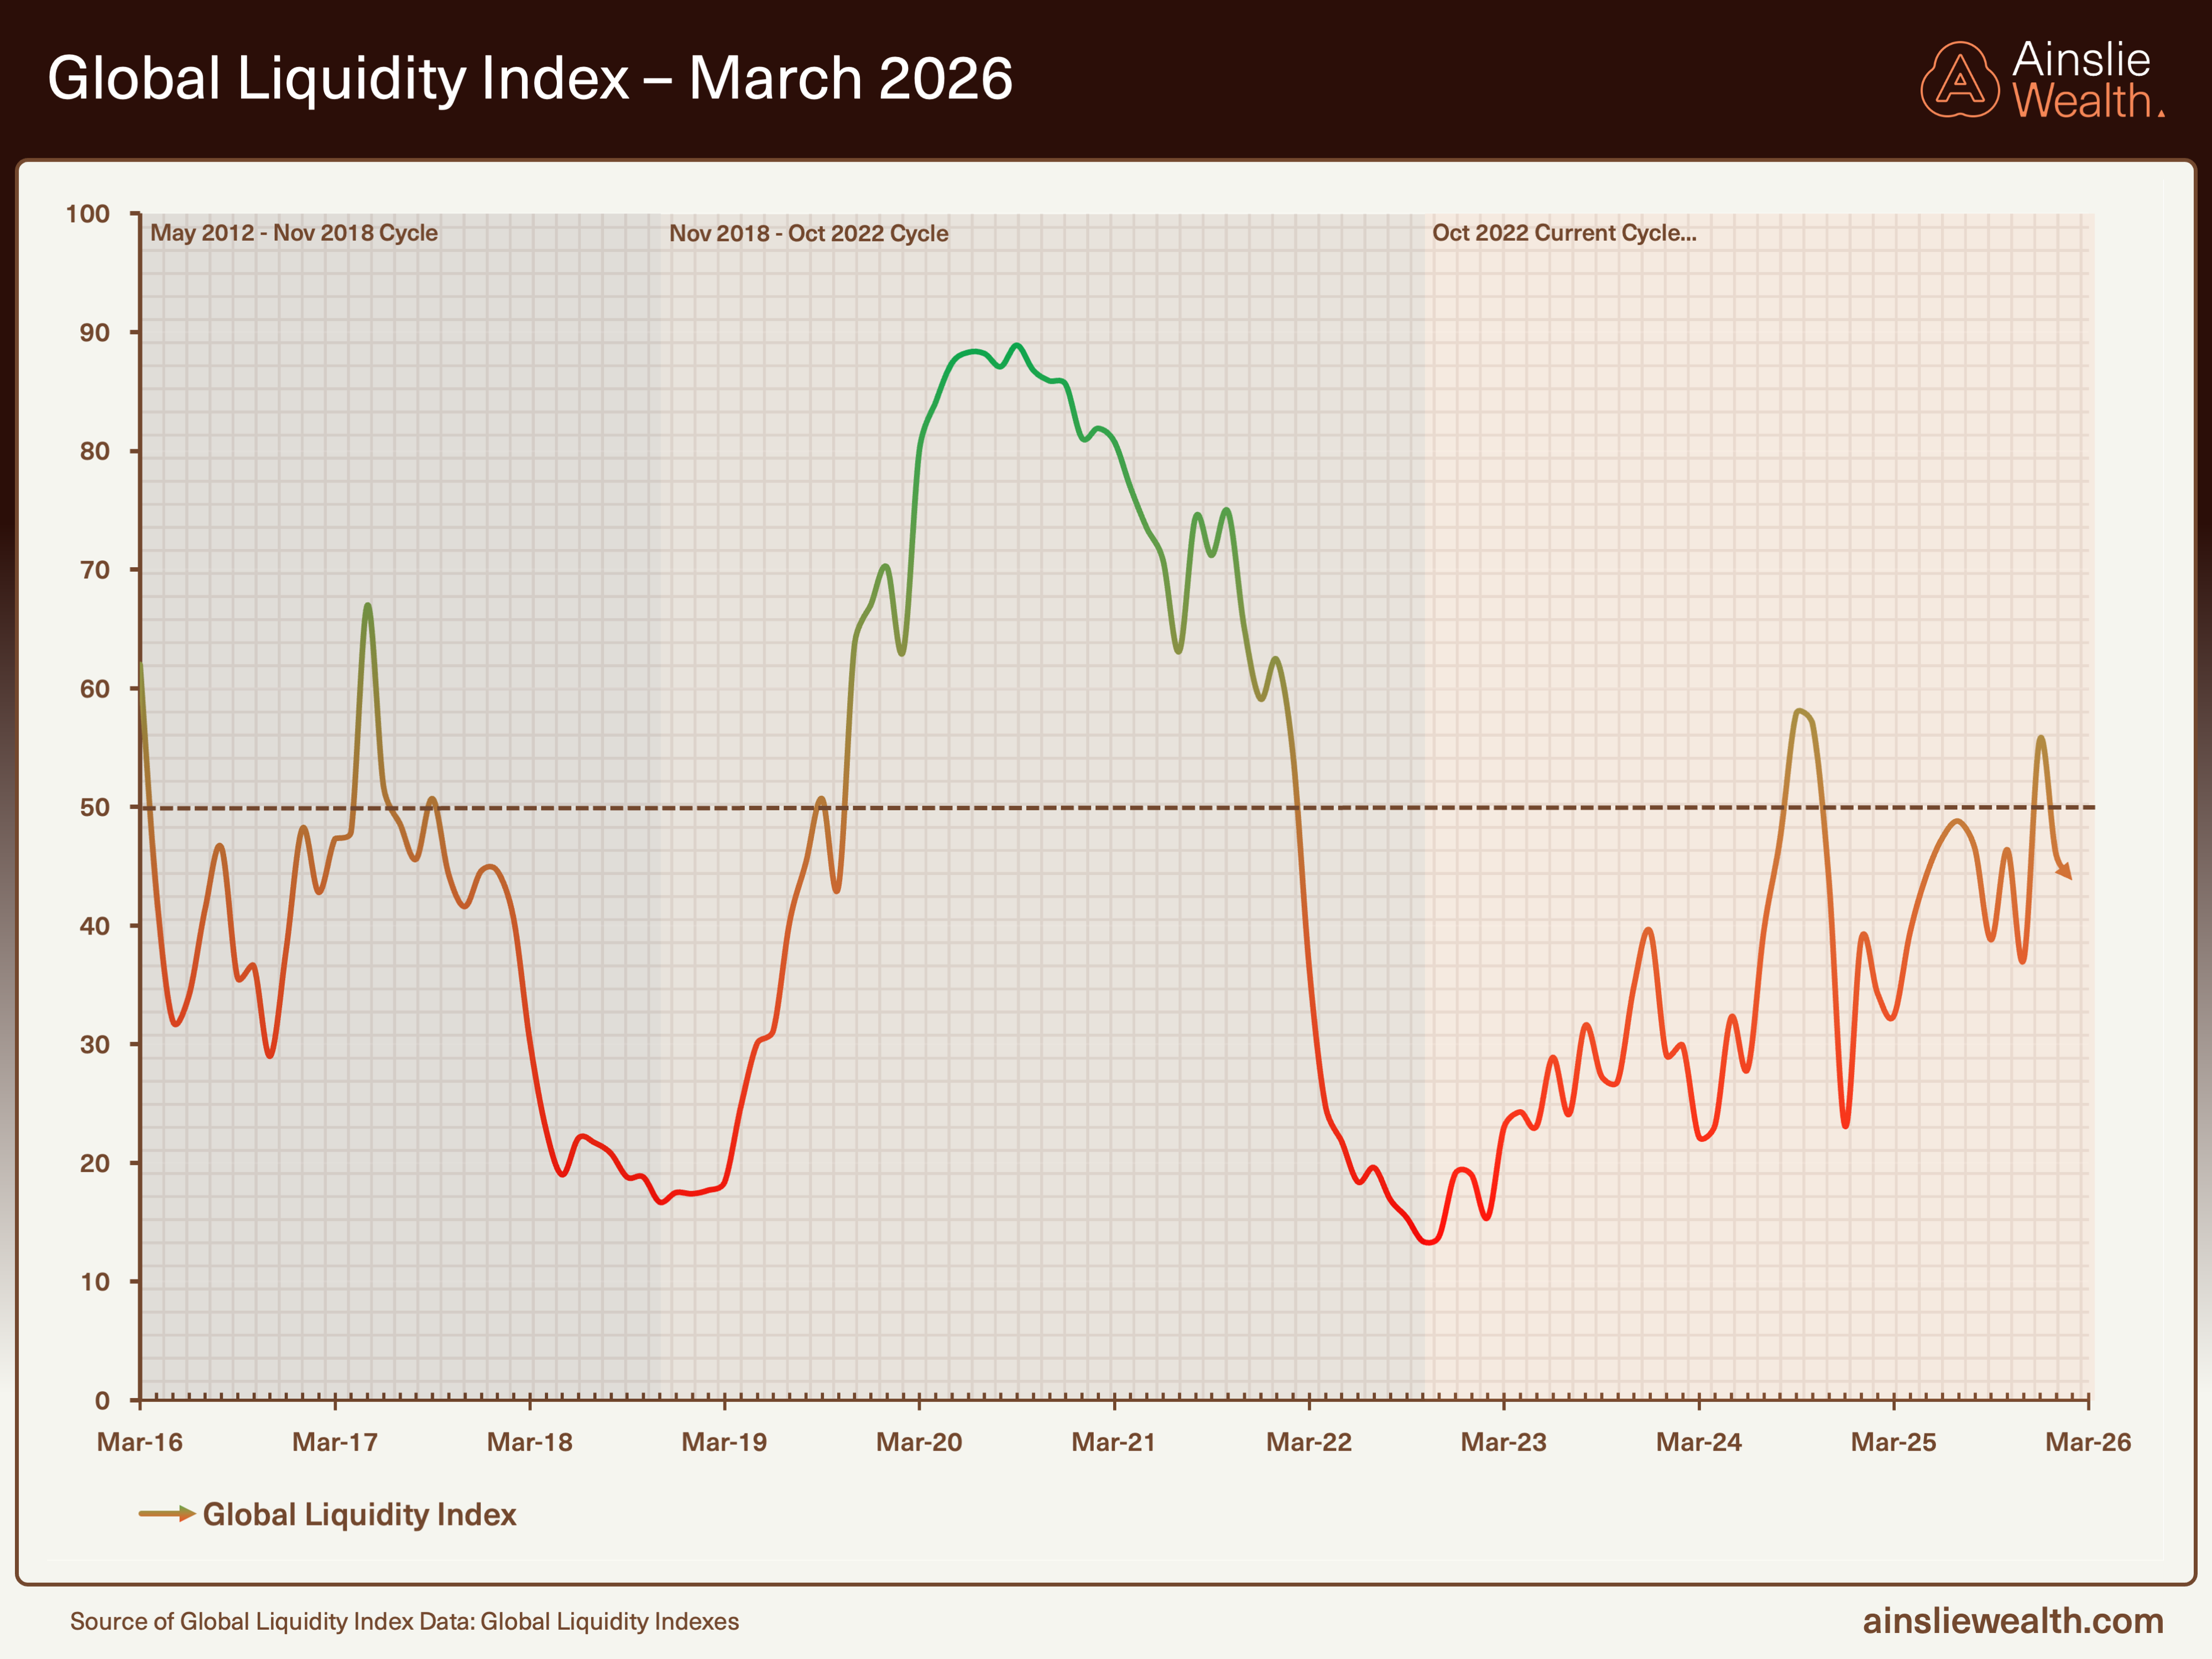
The GLI at 43.8 remains below the 50 expansion threshold. The current cycle peaked at ~58, far below the COVID-era ~90. The projected trough extends into late 2027.
The East-West bifurcation remains the defining feature. China’s PBoC continues aggressive easing to monetise structural debt overhangs, with RMB 6.8 trillion (21.2%) injected over the past year. That liquidity flows overwhelmingly toward gold through official reserve accumulation and encouraged private buying. Western central banks (the Fed, ECB, BoJ, and BoE) remain collectively neutral to contractionary. No developed-market central bank is providing new impulse. We have reached peak stimulus. In the U.S., the shift from Fed QE to Treasury QE redirects monetary energy toward the real economy rather than financial markets. Every rate cut from here confirms the limits of monetary support rather than its potency.
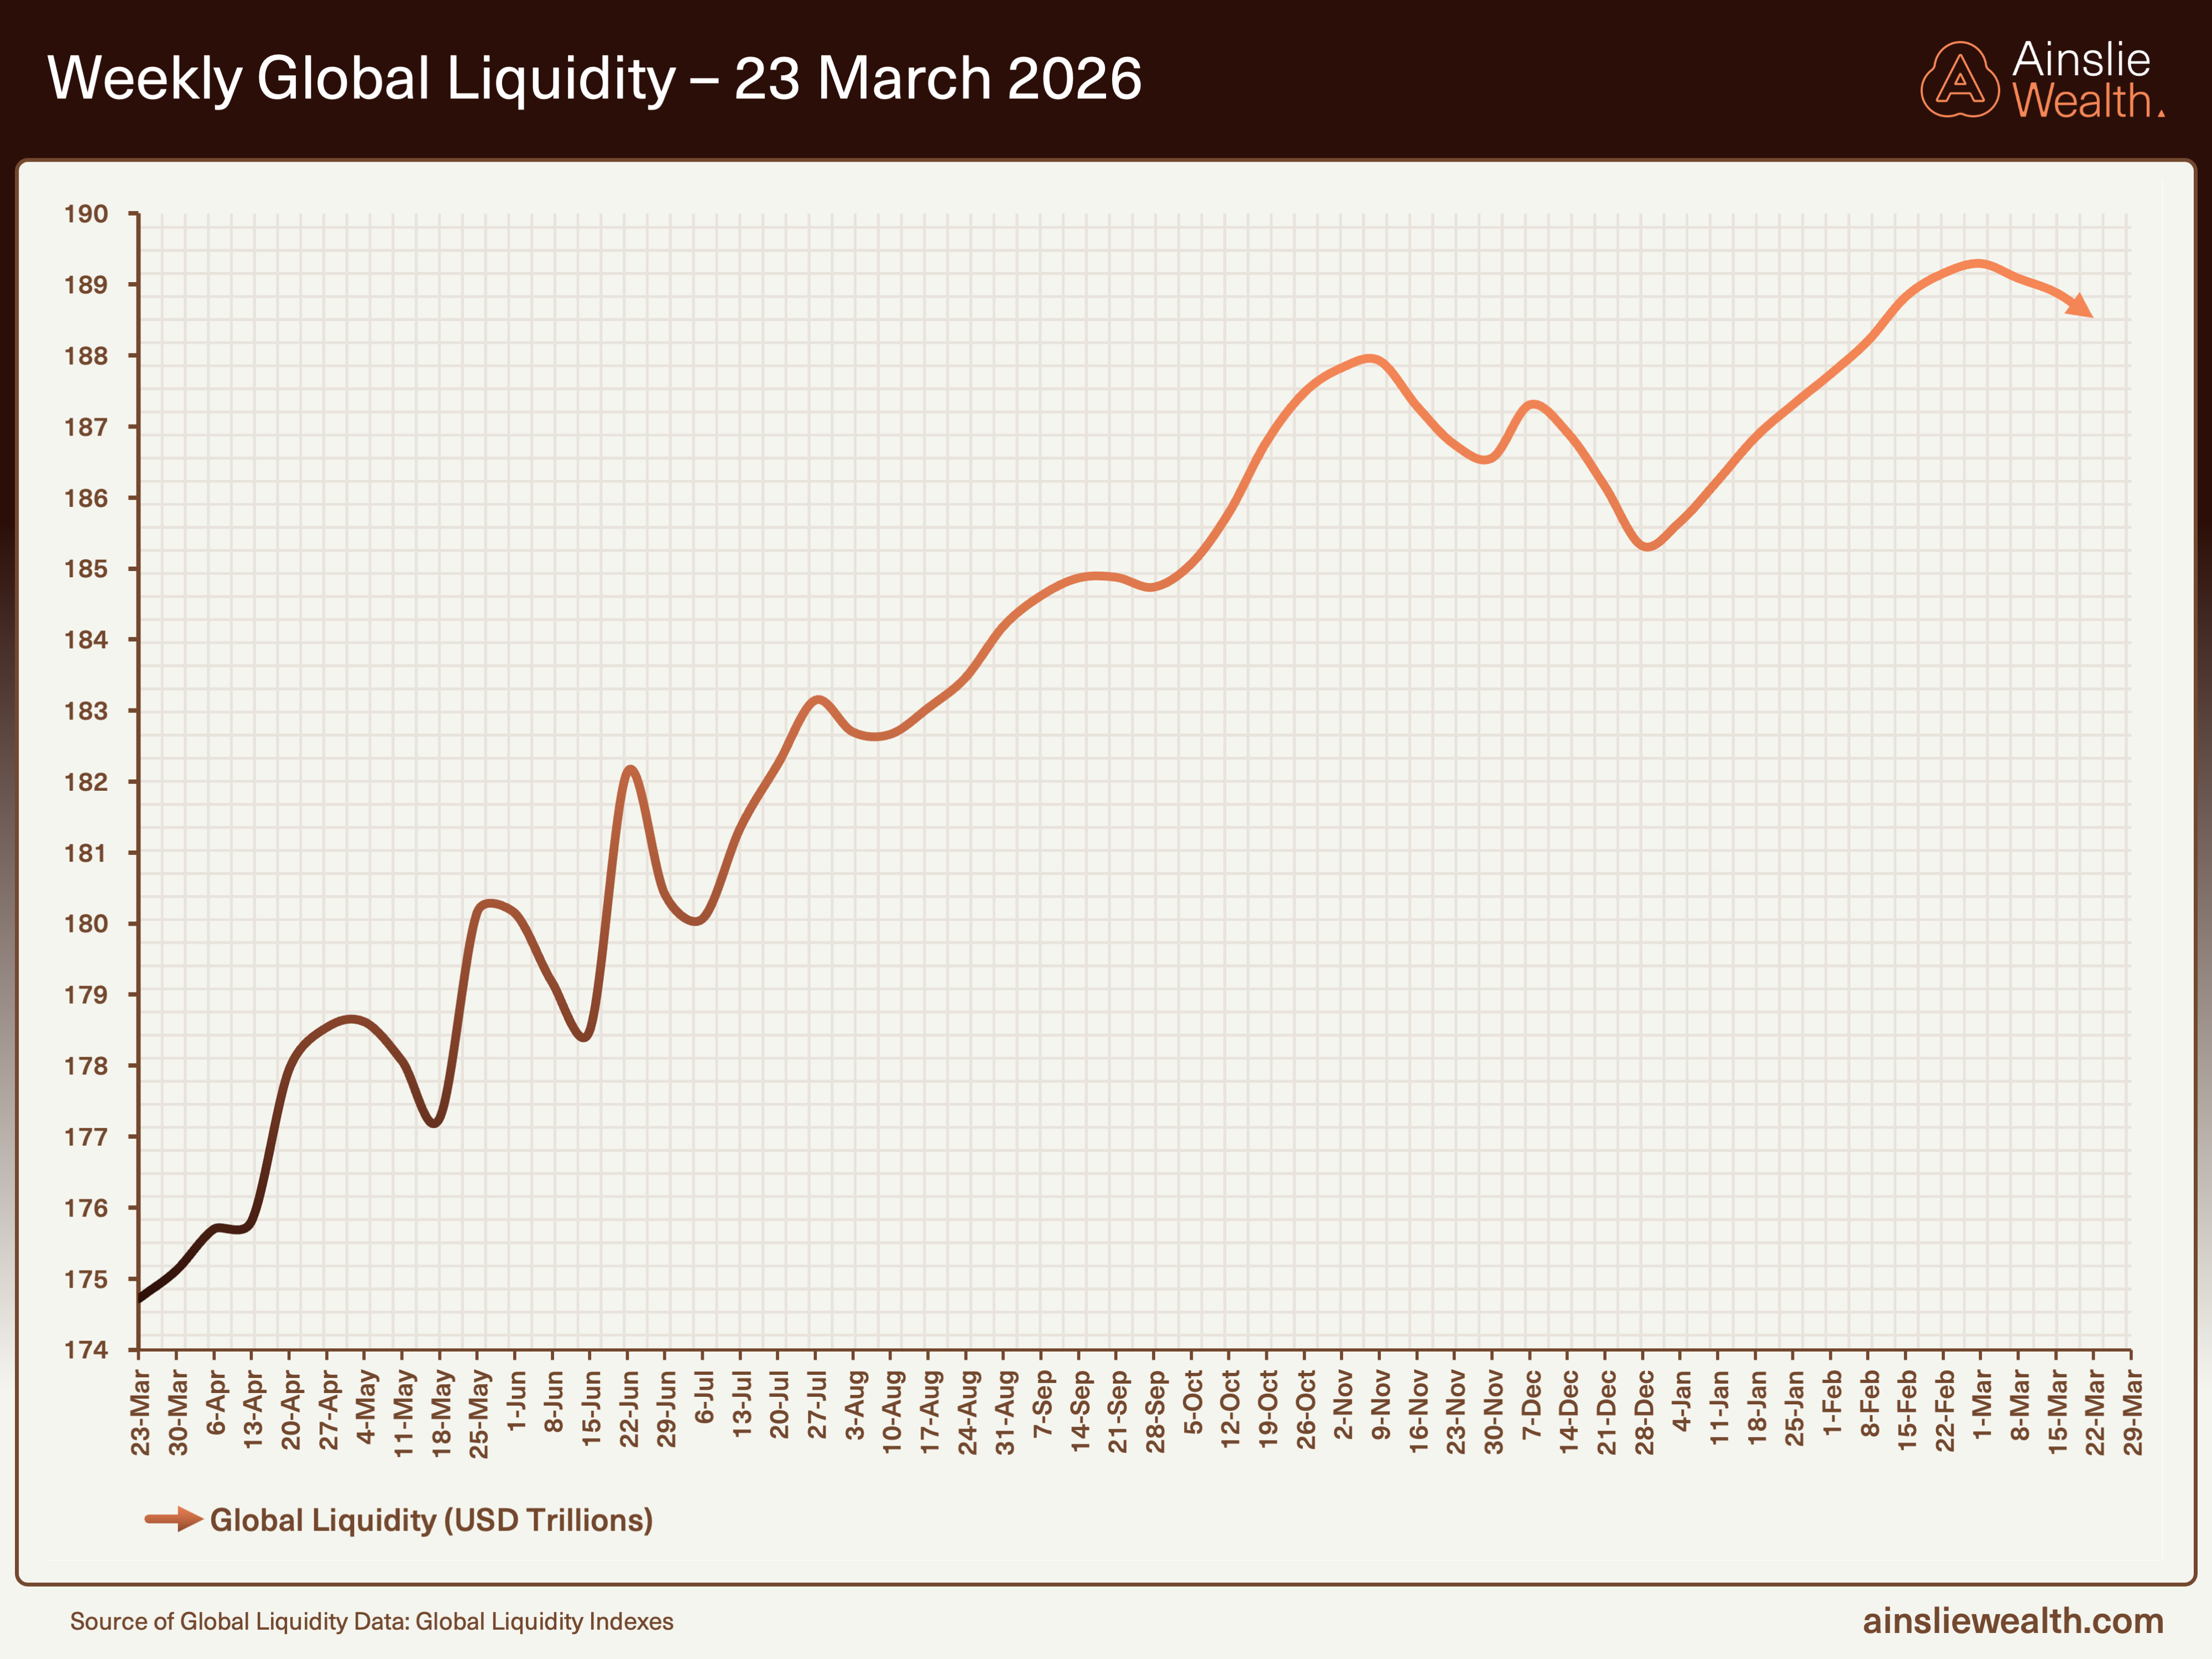
Weekly global liquidity has eased to ~$187.5 trillion from its ~$189 trillion peak. The floor is softening.
3: The Divergence
Global liquidity eases. Bitcoin holds. Gold and silver correct. The divergence this week is a mirror image of recent months.
For the past six months, the story has been gold and silver rising while Bitcoin fell, both moving against a rising liquidity backdrop. This week, with liquidity itself pulling back, gold and silver corrected sharply while Bitcoin was the steadiest of the three. The chart below continues to show the core dynamic: Bitcoin’s price is driven not by how much liquidity exists but by how fast it is growing, particularly in developed economies. Total liquidity near $187.5 trillion still provides a floor. The GLI at 43.8 still removes the impulse.
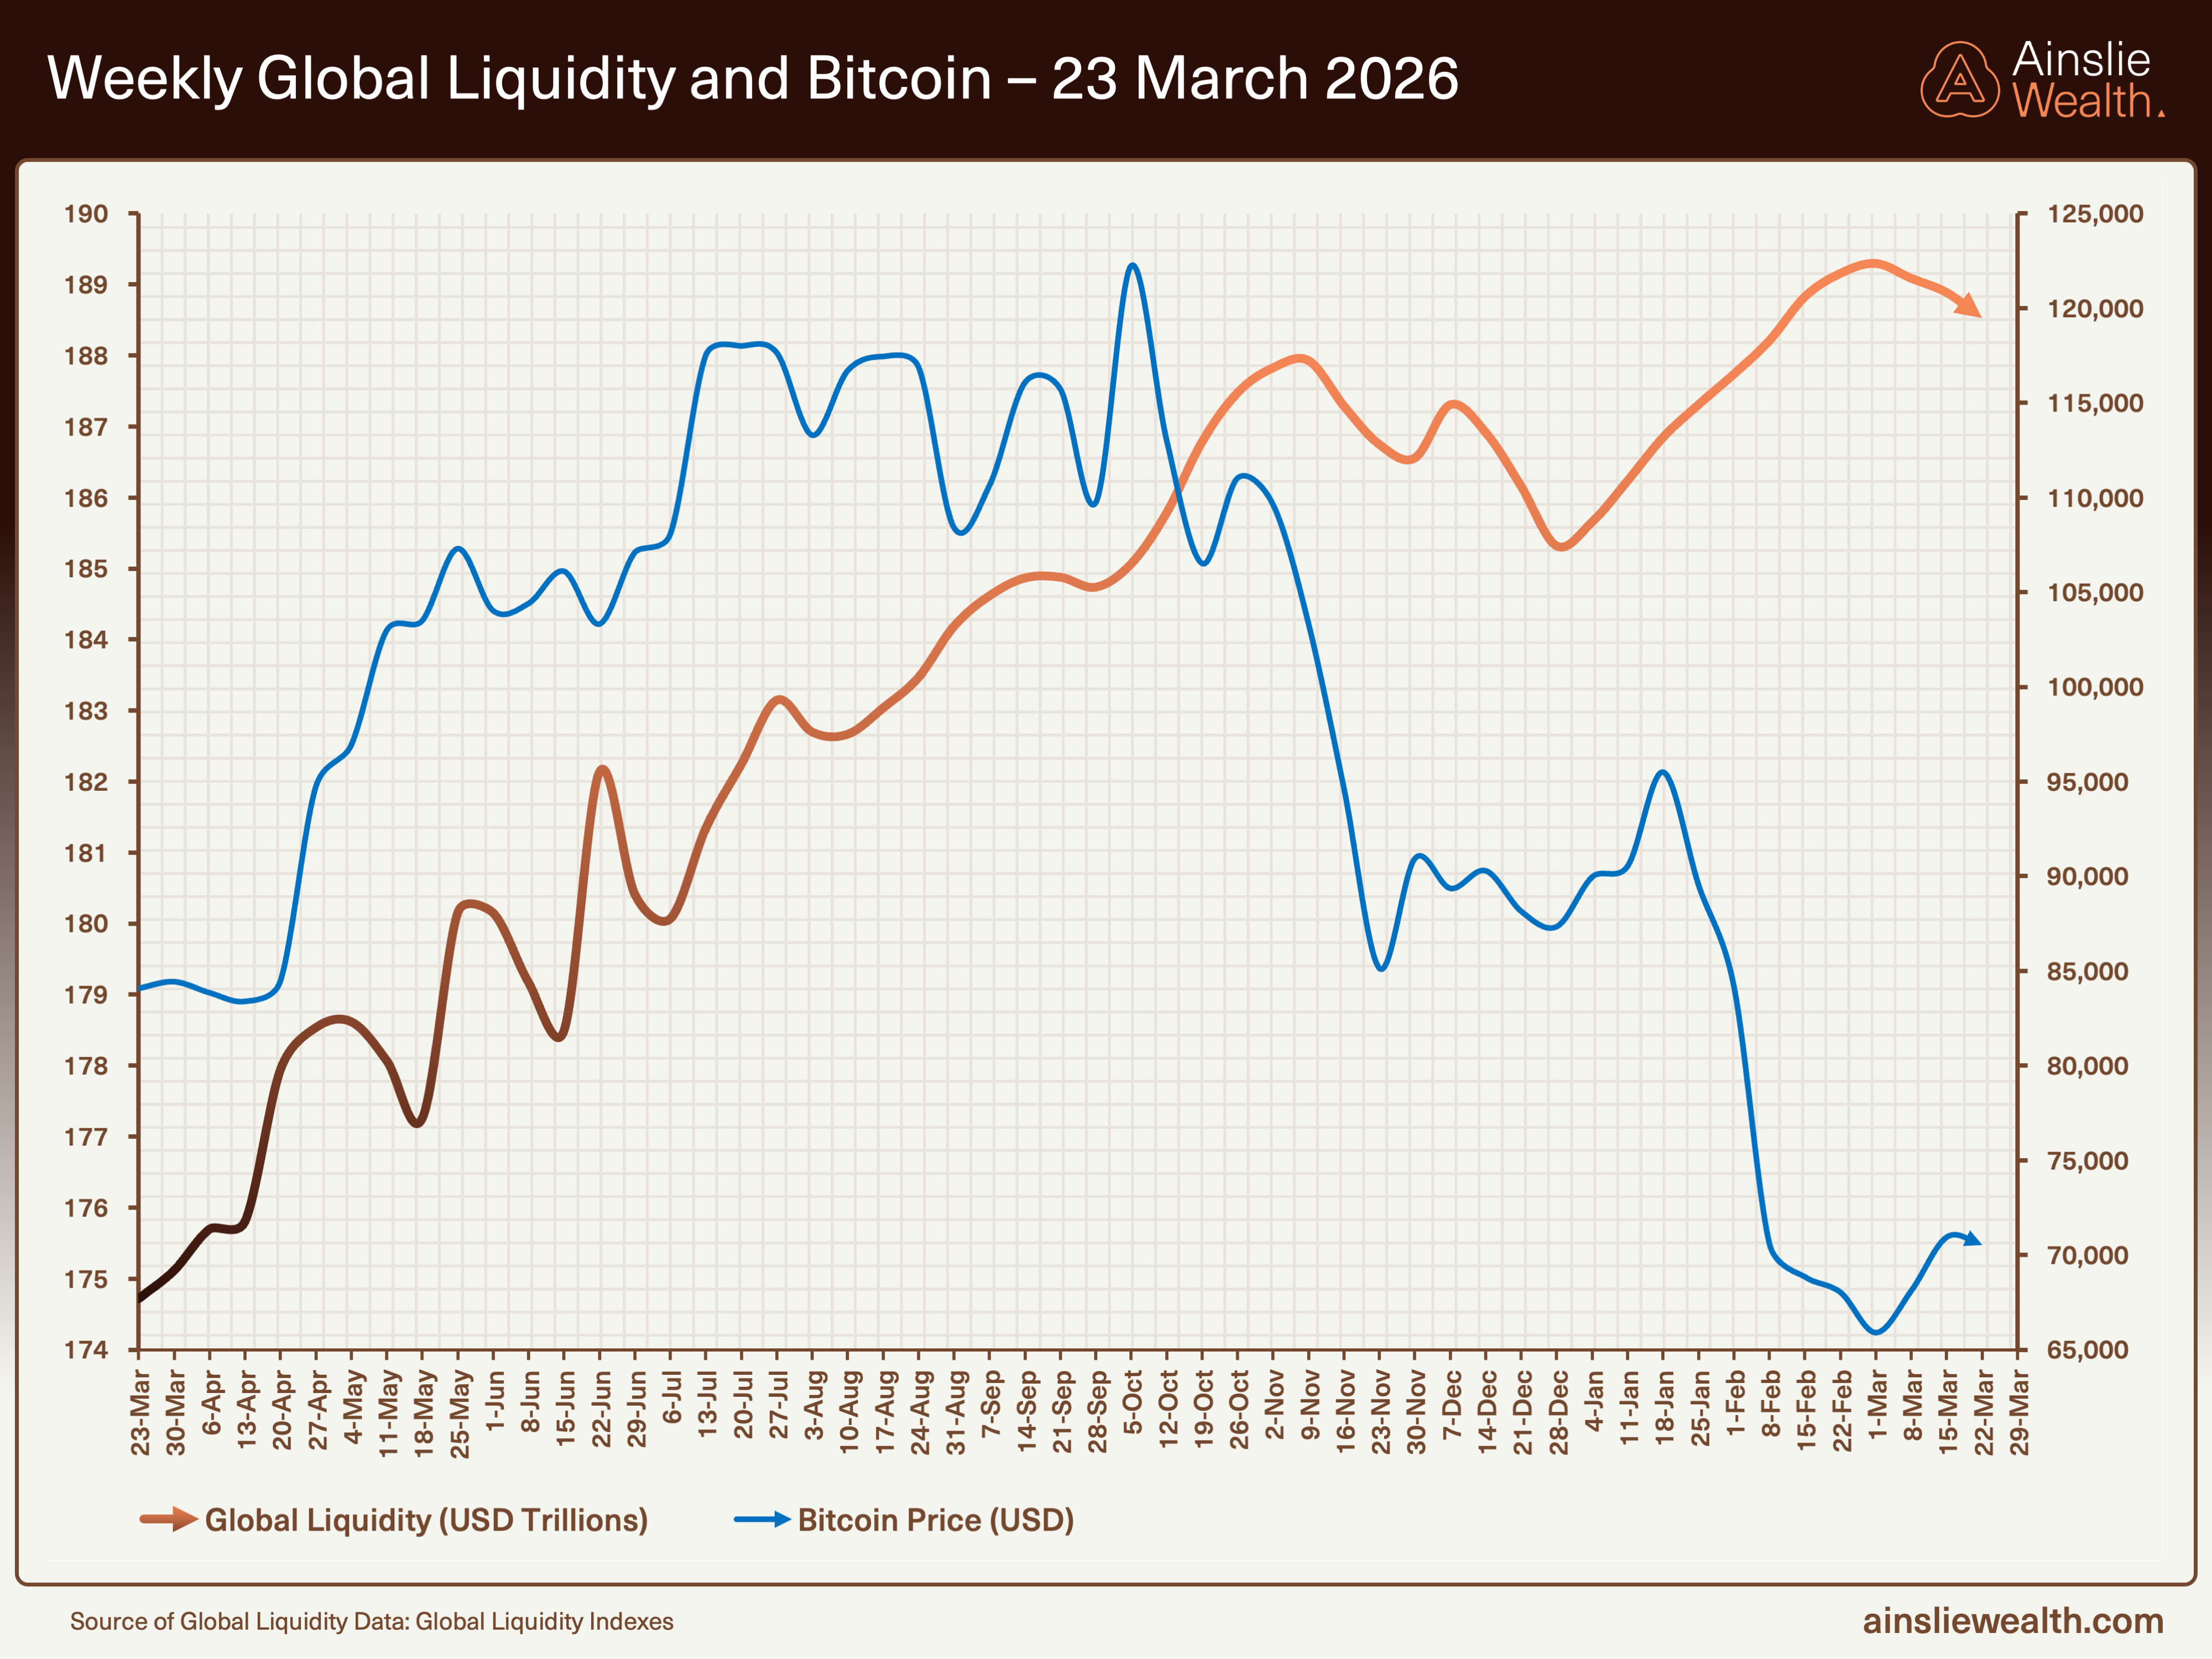
The divergence persists: global liquidity (total level) has risen over the past year while Bitcoin (sensitive to the rate of change) has declined. The gap has narrowed slightly with liquidity easing from its peak.
Gold and silver’s corrections do not alter their structural thesis. Their demand is driven by sovereign reserve accumulation, industrial necessity, and precautionary diversification. These forces do not require liquidity momentum. They require uncertainty, and uncertainty remains abundant. But the pullback is a reminder that even structurally-supported assets correct when they run too far, too fast. Corrections consolidate rather than reverse.
The framework-consistent response remains the same: structure governs destination, reflexivity governs route. Accumulation through the deceleration positions for the acceleration that follows.
4: Macro Drivers
The dollar weakened and bond volatility erupted. Both moved significantly this week, and they are pulling in opposite directions on global liquidity.
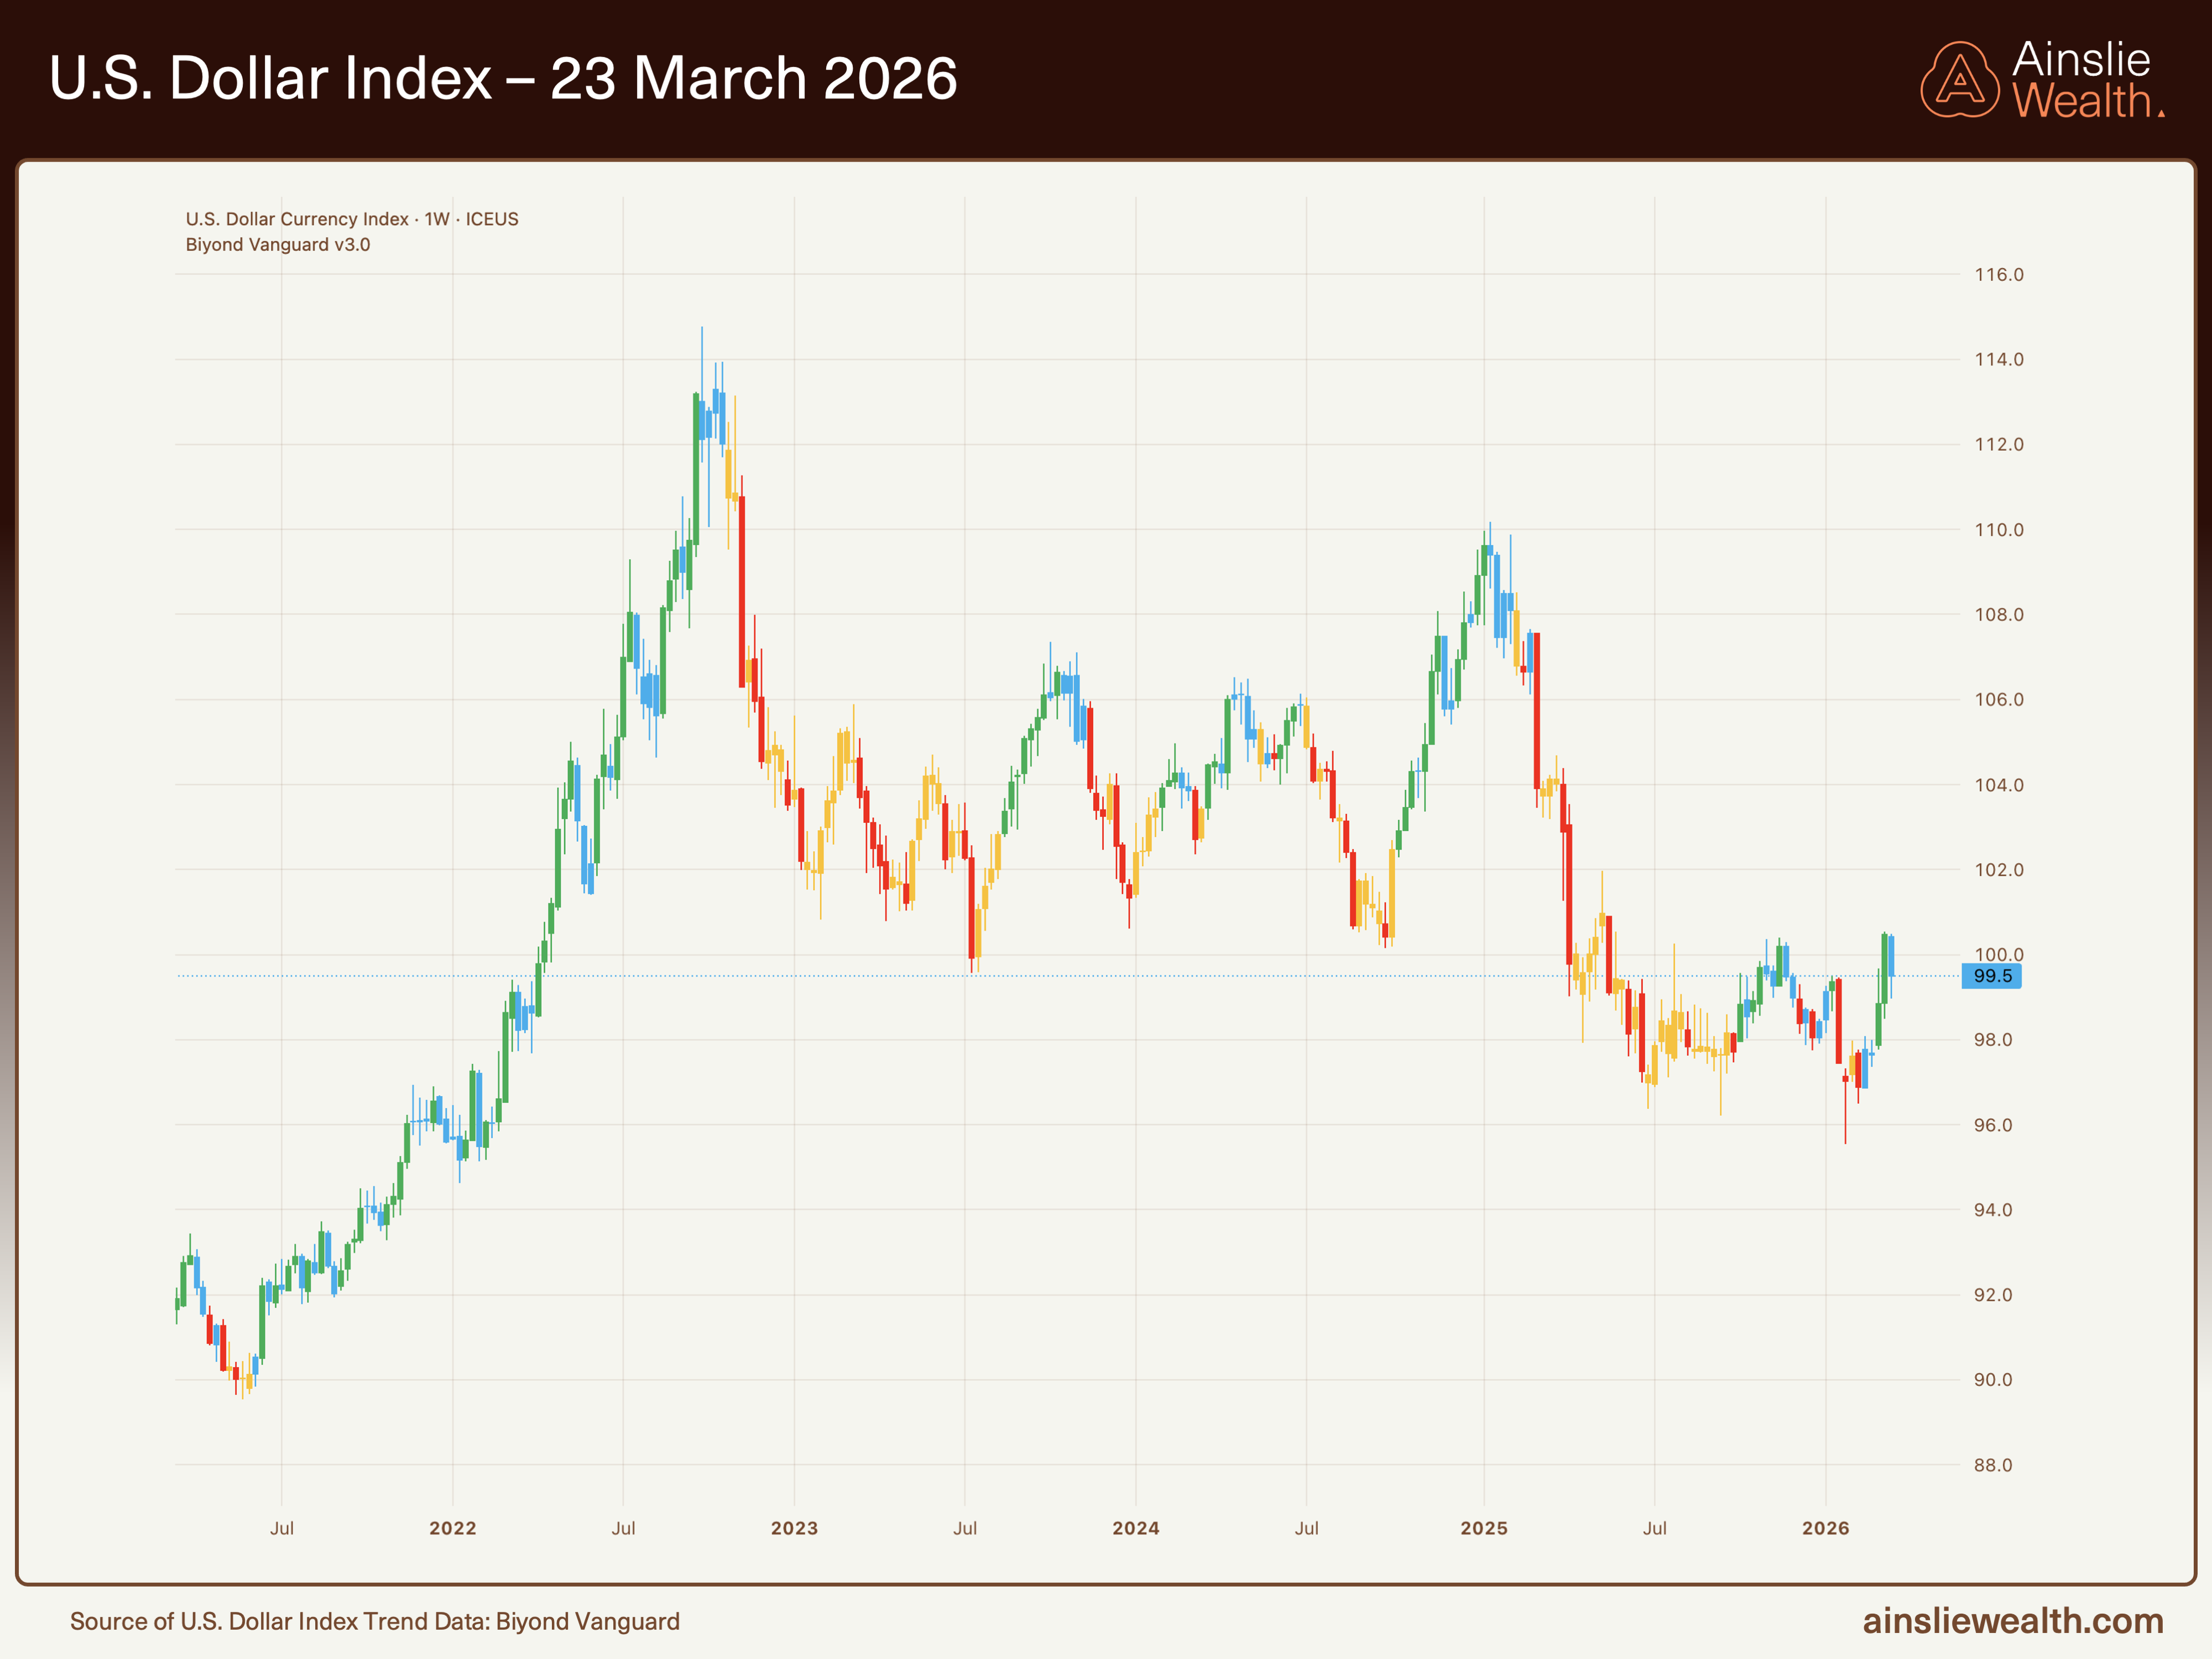
DXY at 99.5: the dollar has weakened from 100.50 last week, falling below the psychologically significant 100 level.
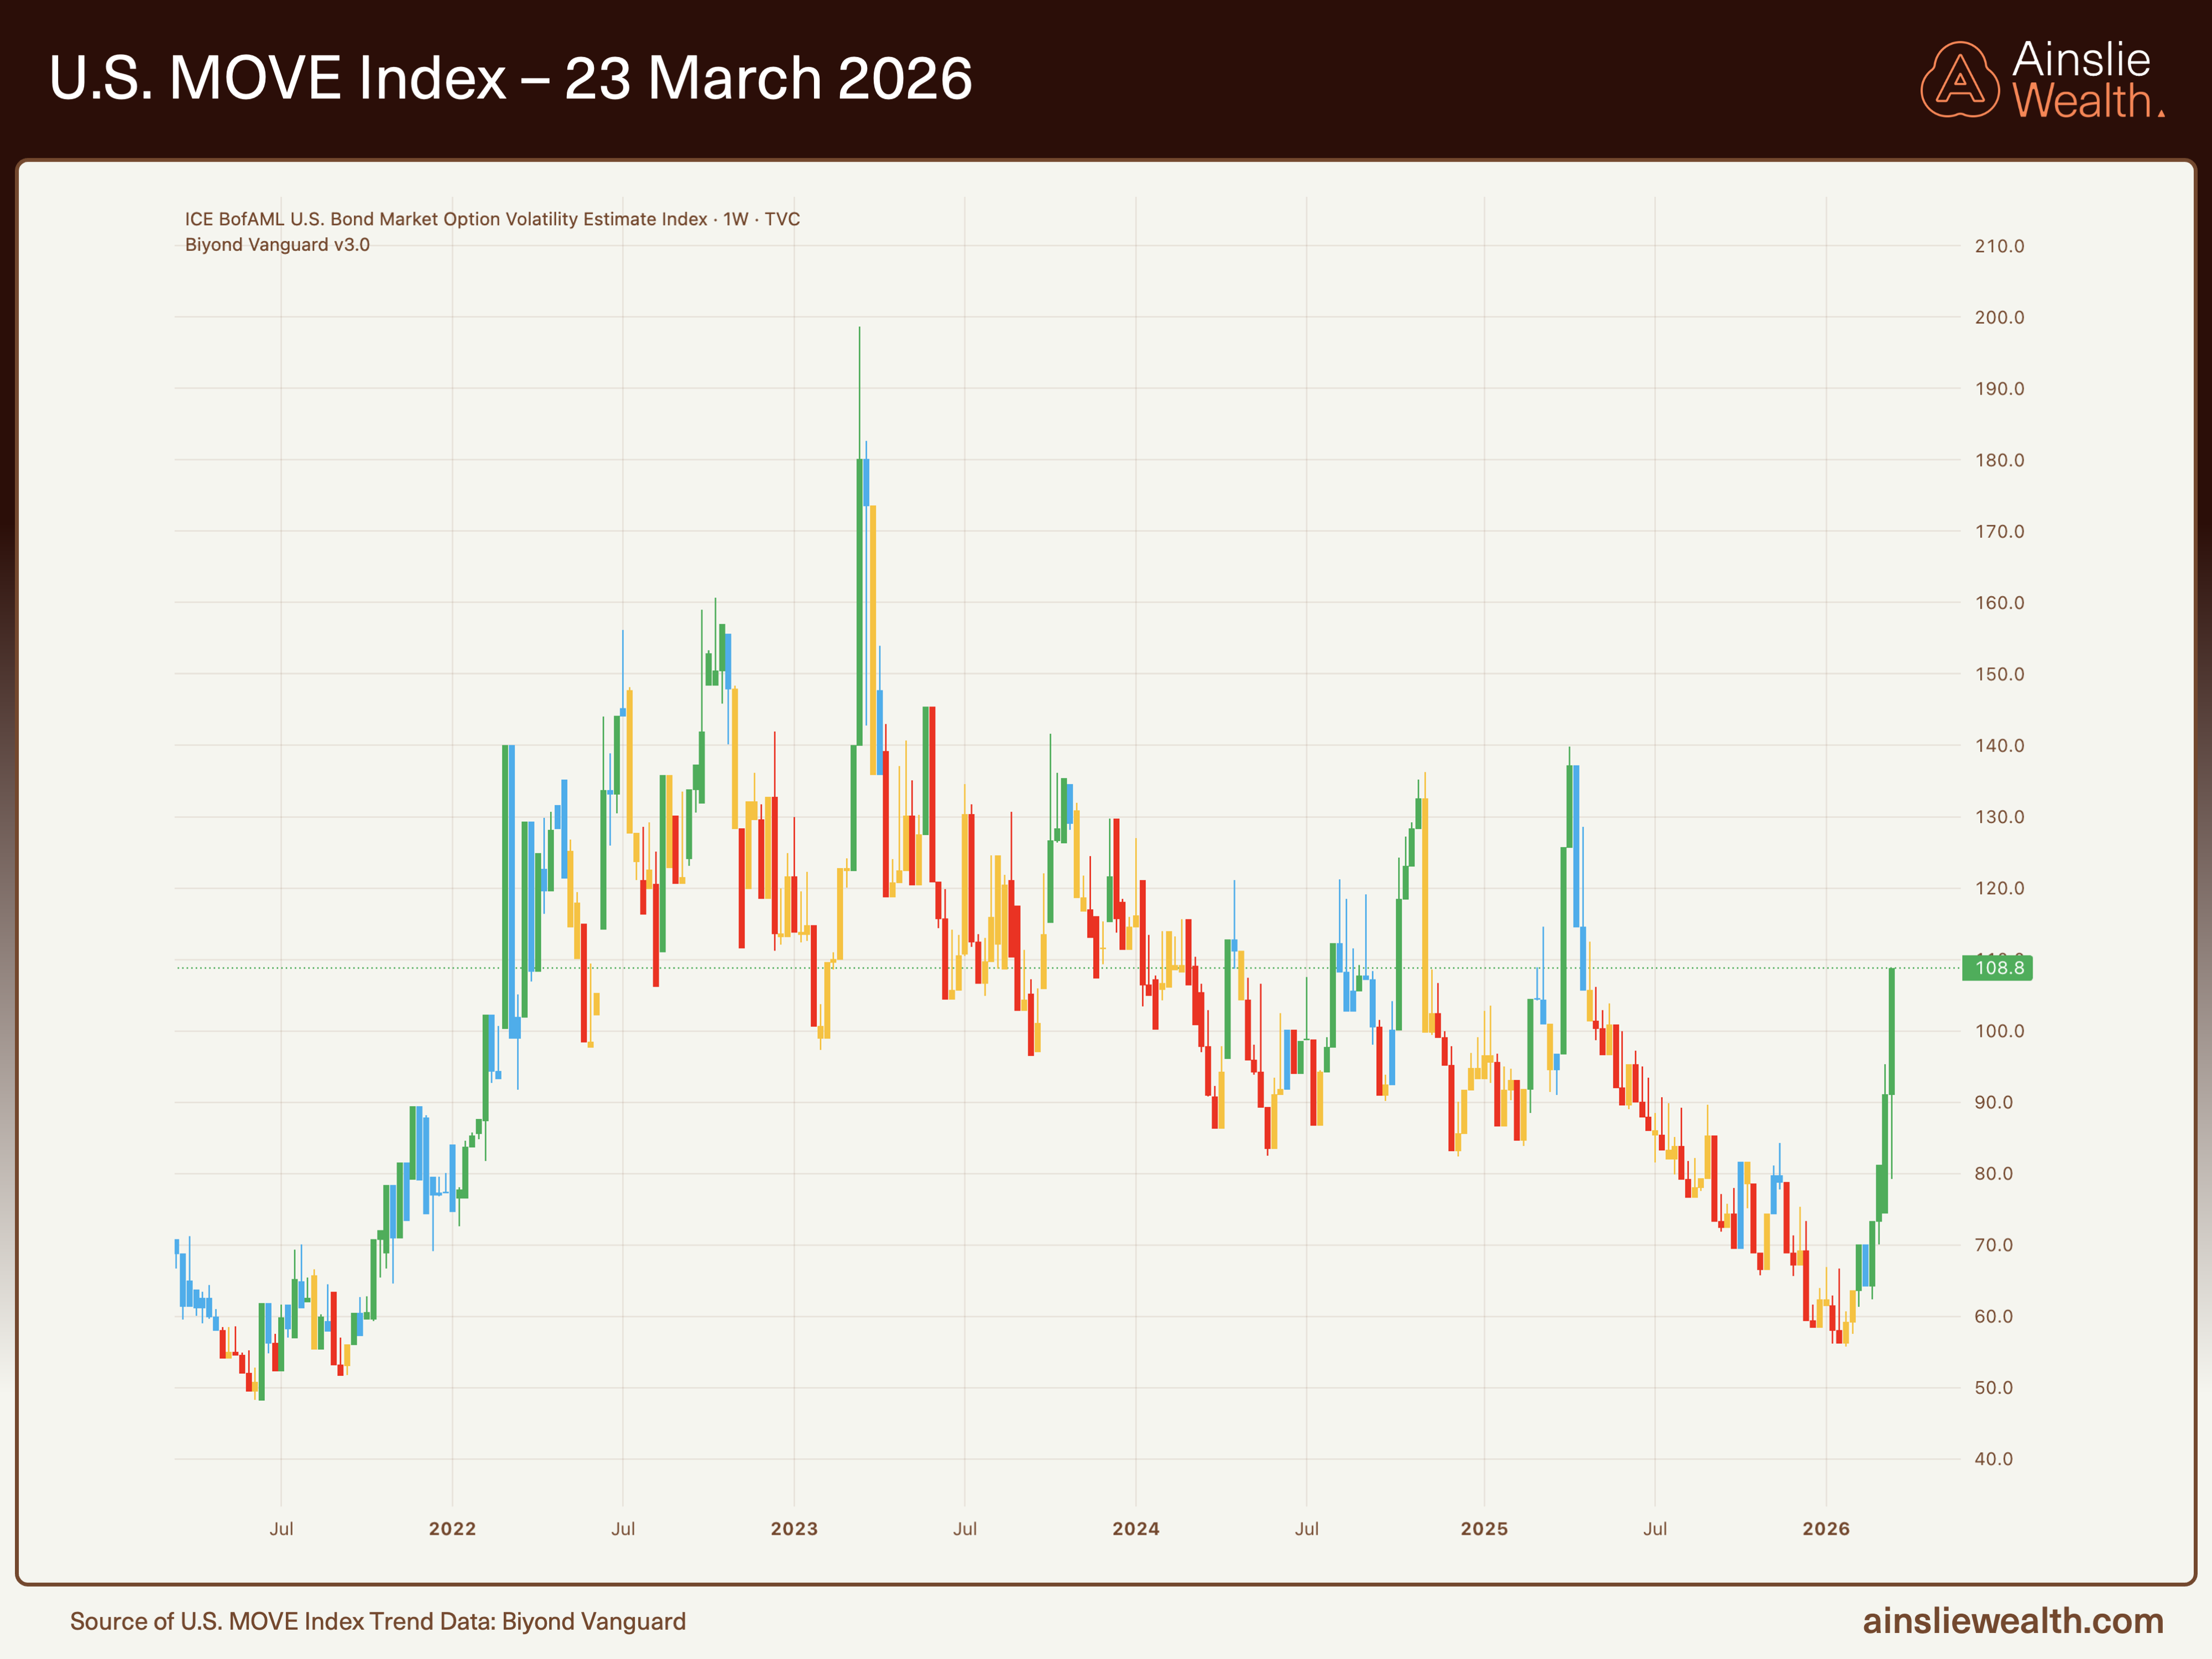
MOVE at 108.8: bond volatility has surged from 91.17 last week, well above the 90 threshold where collateral haircuts begin to tighten financial conditions materially.
The U.S. dollar index at 99.5 has weakened from 100.50 last week, falling below the psychologically significant 100 level. Dollar weakness helps global liquidity: approximately 60% of global trade is invoiced in dollars, and a significant share of global debt is denominated in it. When the dollar weakens, non-U.S. liquidity contributions expand in common currency terms. A modest tailwind.
The MOVE index at 108.8 tells the more urgent story. Last week, this report flagged the crossing of 90 as a warning. This week, the index has surged nearly 20 points higher. Banks and financial institutions borrow against bonds they hold as collateral. When bond markets become volatile, lenders demand bigger discounts on those bonds (called haircuts), meaning the same bond supports less borrowing, less leverage, and less liquidity. At 91, this mechanism was beginning to constrain. At 108.8, it is actively constraining. The collateral multiplier is contracting meaningfully. This is a direct channel through which bond volatility drains liquidity from the system, compounding the deceleration already underway in the GLI.
The dollar’s weakness and the MOVE’s surge create a tension: one modestly supports liquidity while the other actively drains it. The collateral channel is the stronger force. A weaker dollar helps at the margins, but it cannot offset the damage done by a 20-point MOVE spike in a single week.
5: Under the Hood
This section examines the U.S. economy as the world’s largest and the primary driver of advanced-economy liquidity conditions. It captures the dominant signal but not the complete global picture. The liquidity bifurcation discussed in Section 2, where China’s PBoC operates on an entirely different easing trajectory, is a reminder that U.S. conditions shape but do not fully define global outcomes. With that framing, the U.S. data deserves close attention because it is where the tension between growth, inflation, and debt is most visible.
The growth picture is surprisingly resilient on the surface. Manufacturing PMI has climbed to approximately 52.5, back into expansion territory after spending most of 2022 through 2025 below or near the 50 threshold. Services PMI at approximately 56 shows the stronger end of the economy continuing to expand. The three-month leading indicator has risen to approximately 55, pulling back from a spike near 59 but still projecting expansion.
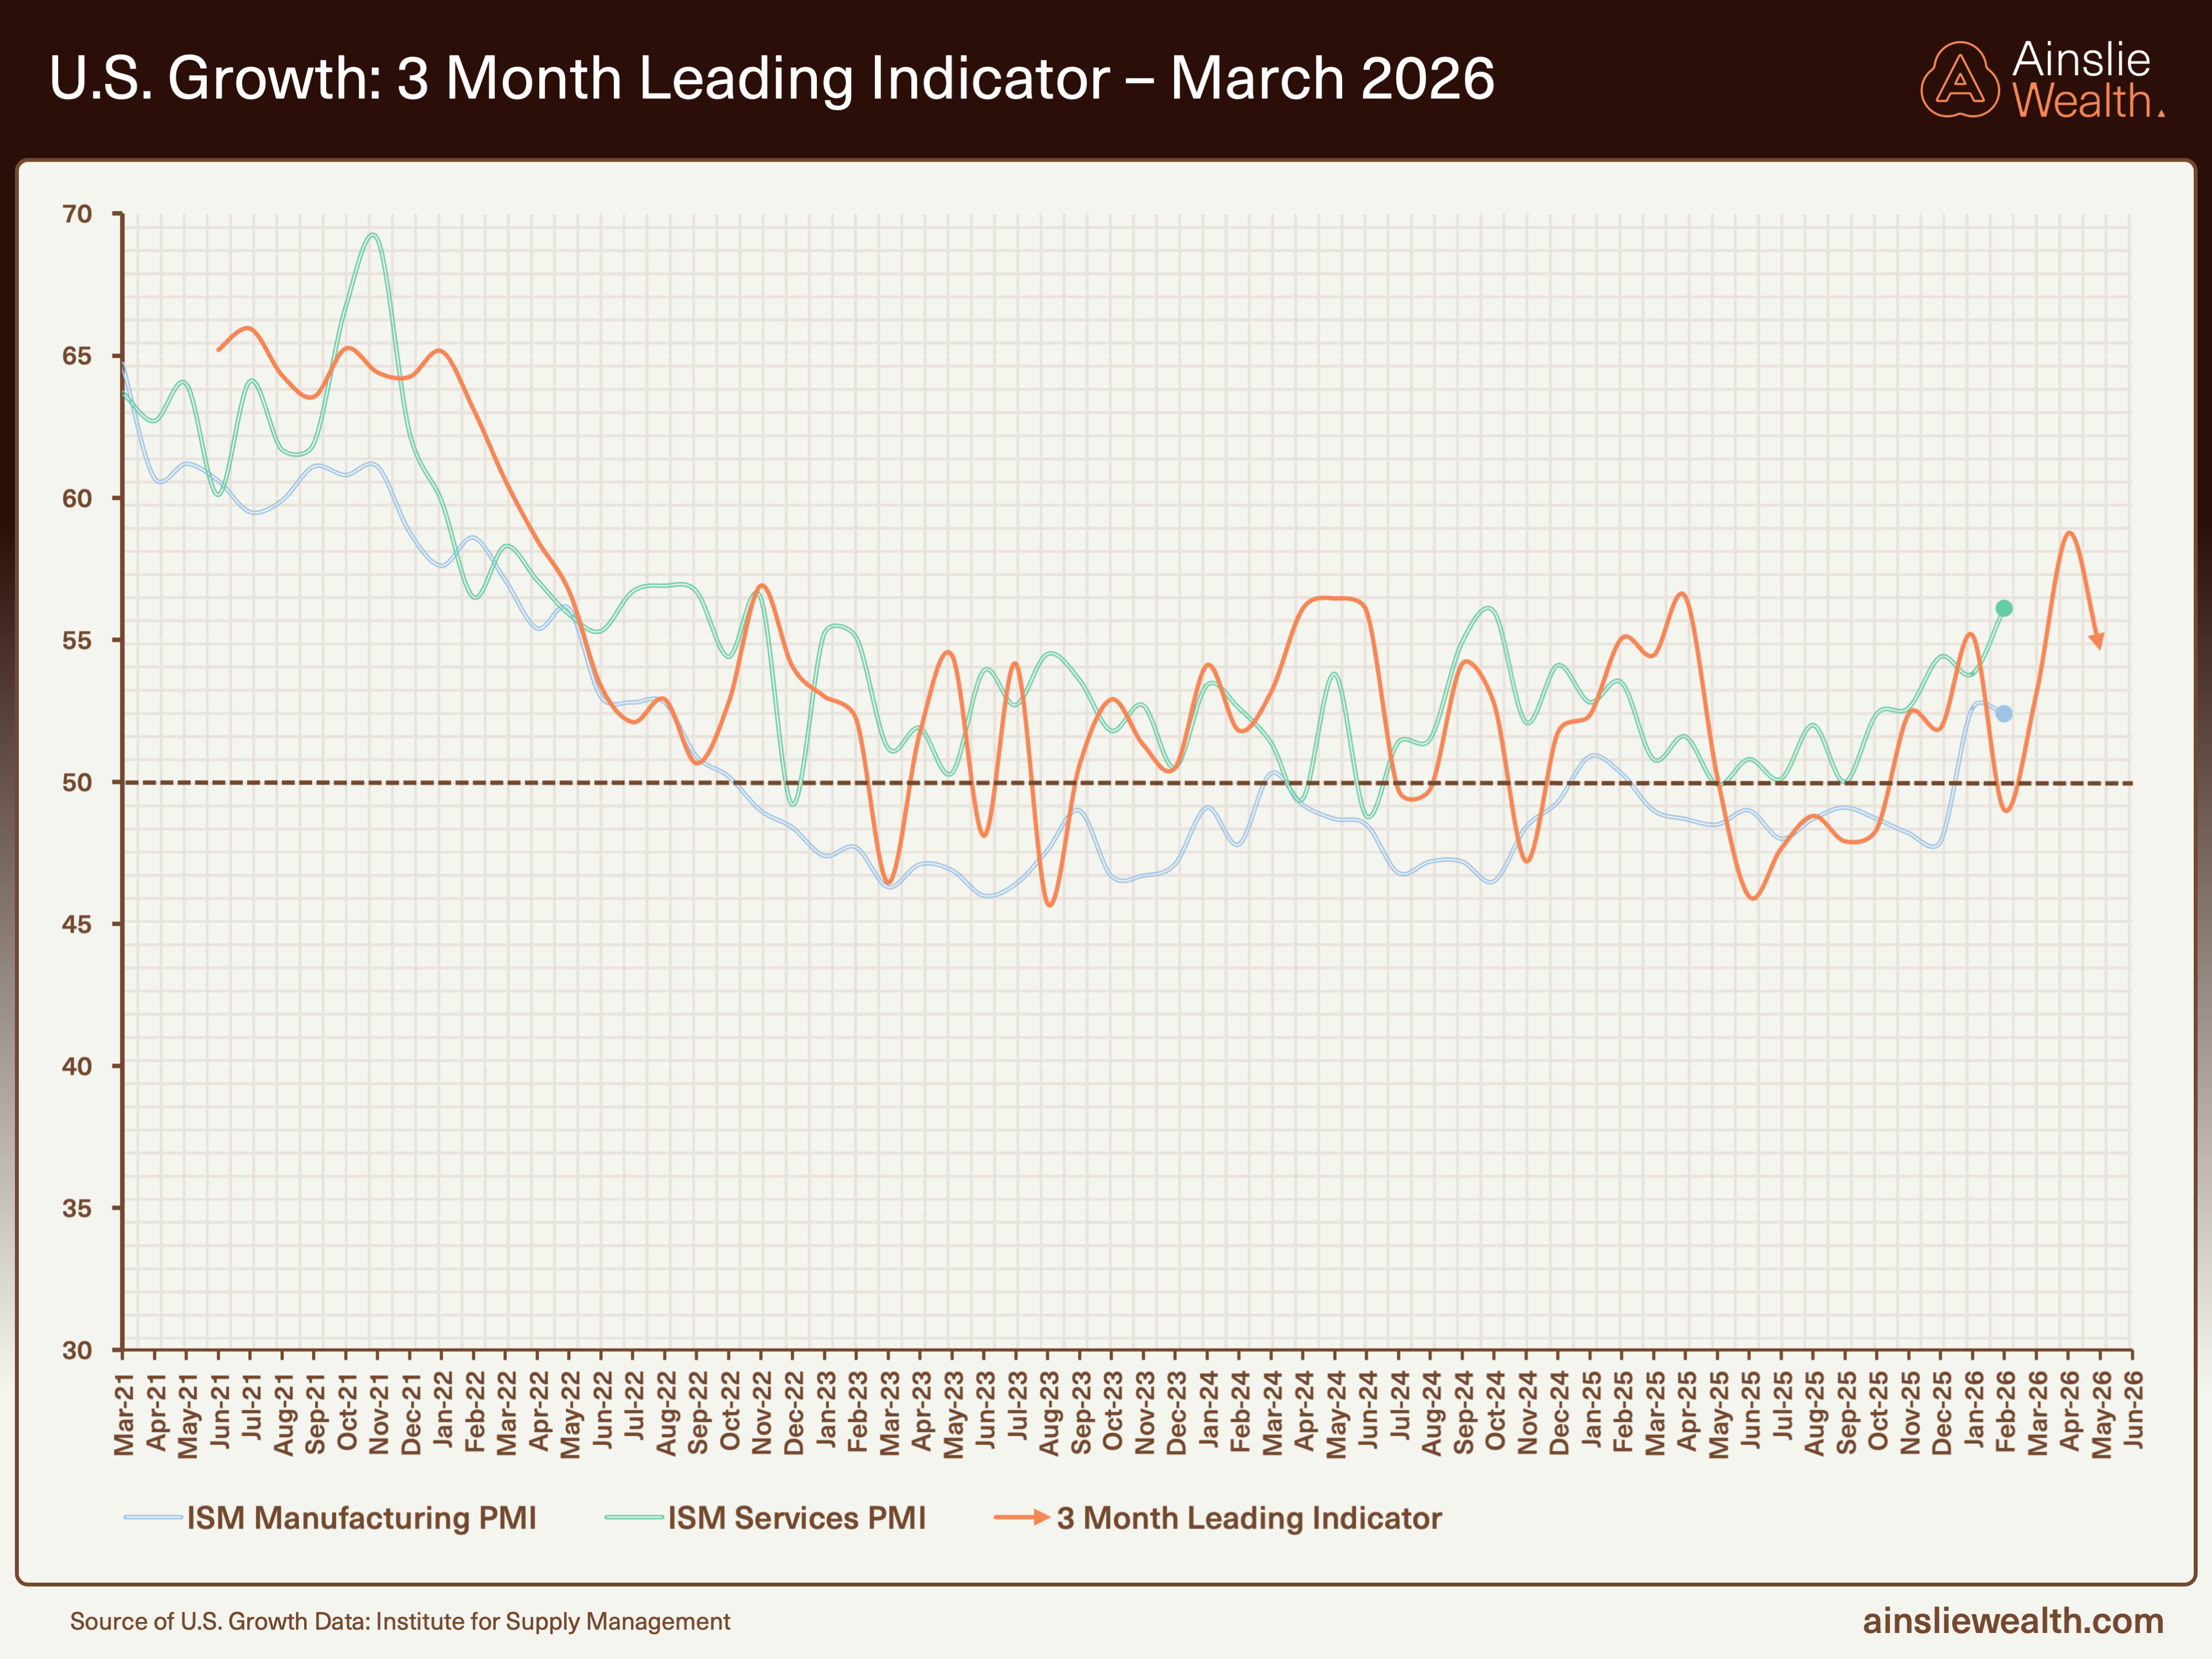
Growth leading indicator at ~55, pulling back from ~59. Manufacturing PMI at ~52.5, Services at ~56. All three above the 50 expansion threshold.
This strength is real, and it complicates the simple bearish narrative. But it also illustrates the productive absorption dynamic at the core of this report’s thesis: when the real economy is growing, businesses invest in equipment, hire workers, and build capacity. That investment absorbs capital that might otherwise flow into financial markets. Strong economic data is not unambiguously good for portfolios. It means the real economy is claiming resources that once fuelled speculative returns. The same AI infrastructure investment that drives growth simultaneously compresses the white-collar professional layer that historically sustained consumer momentum. Growth today can plant the seeds of demand weakness tomorrow.
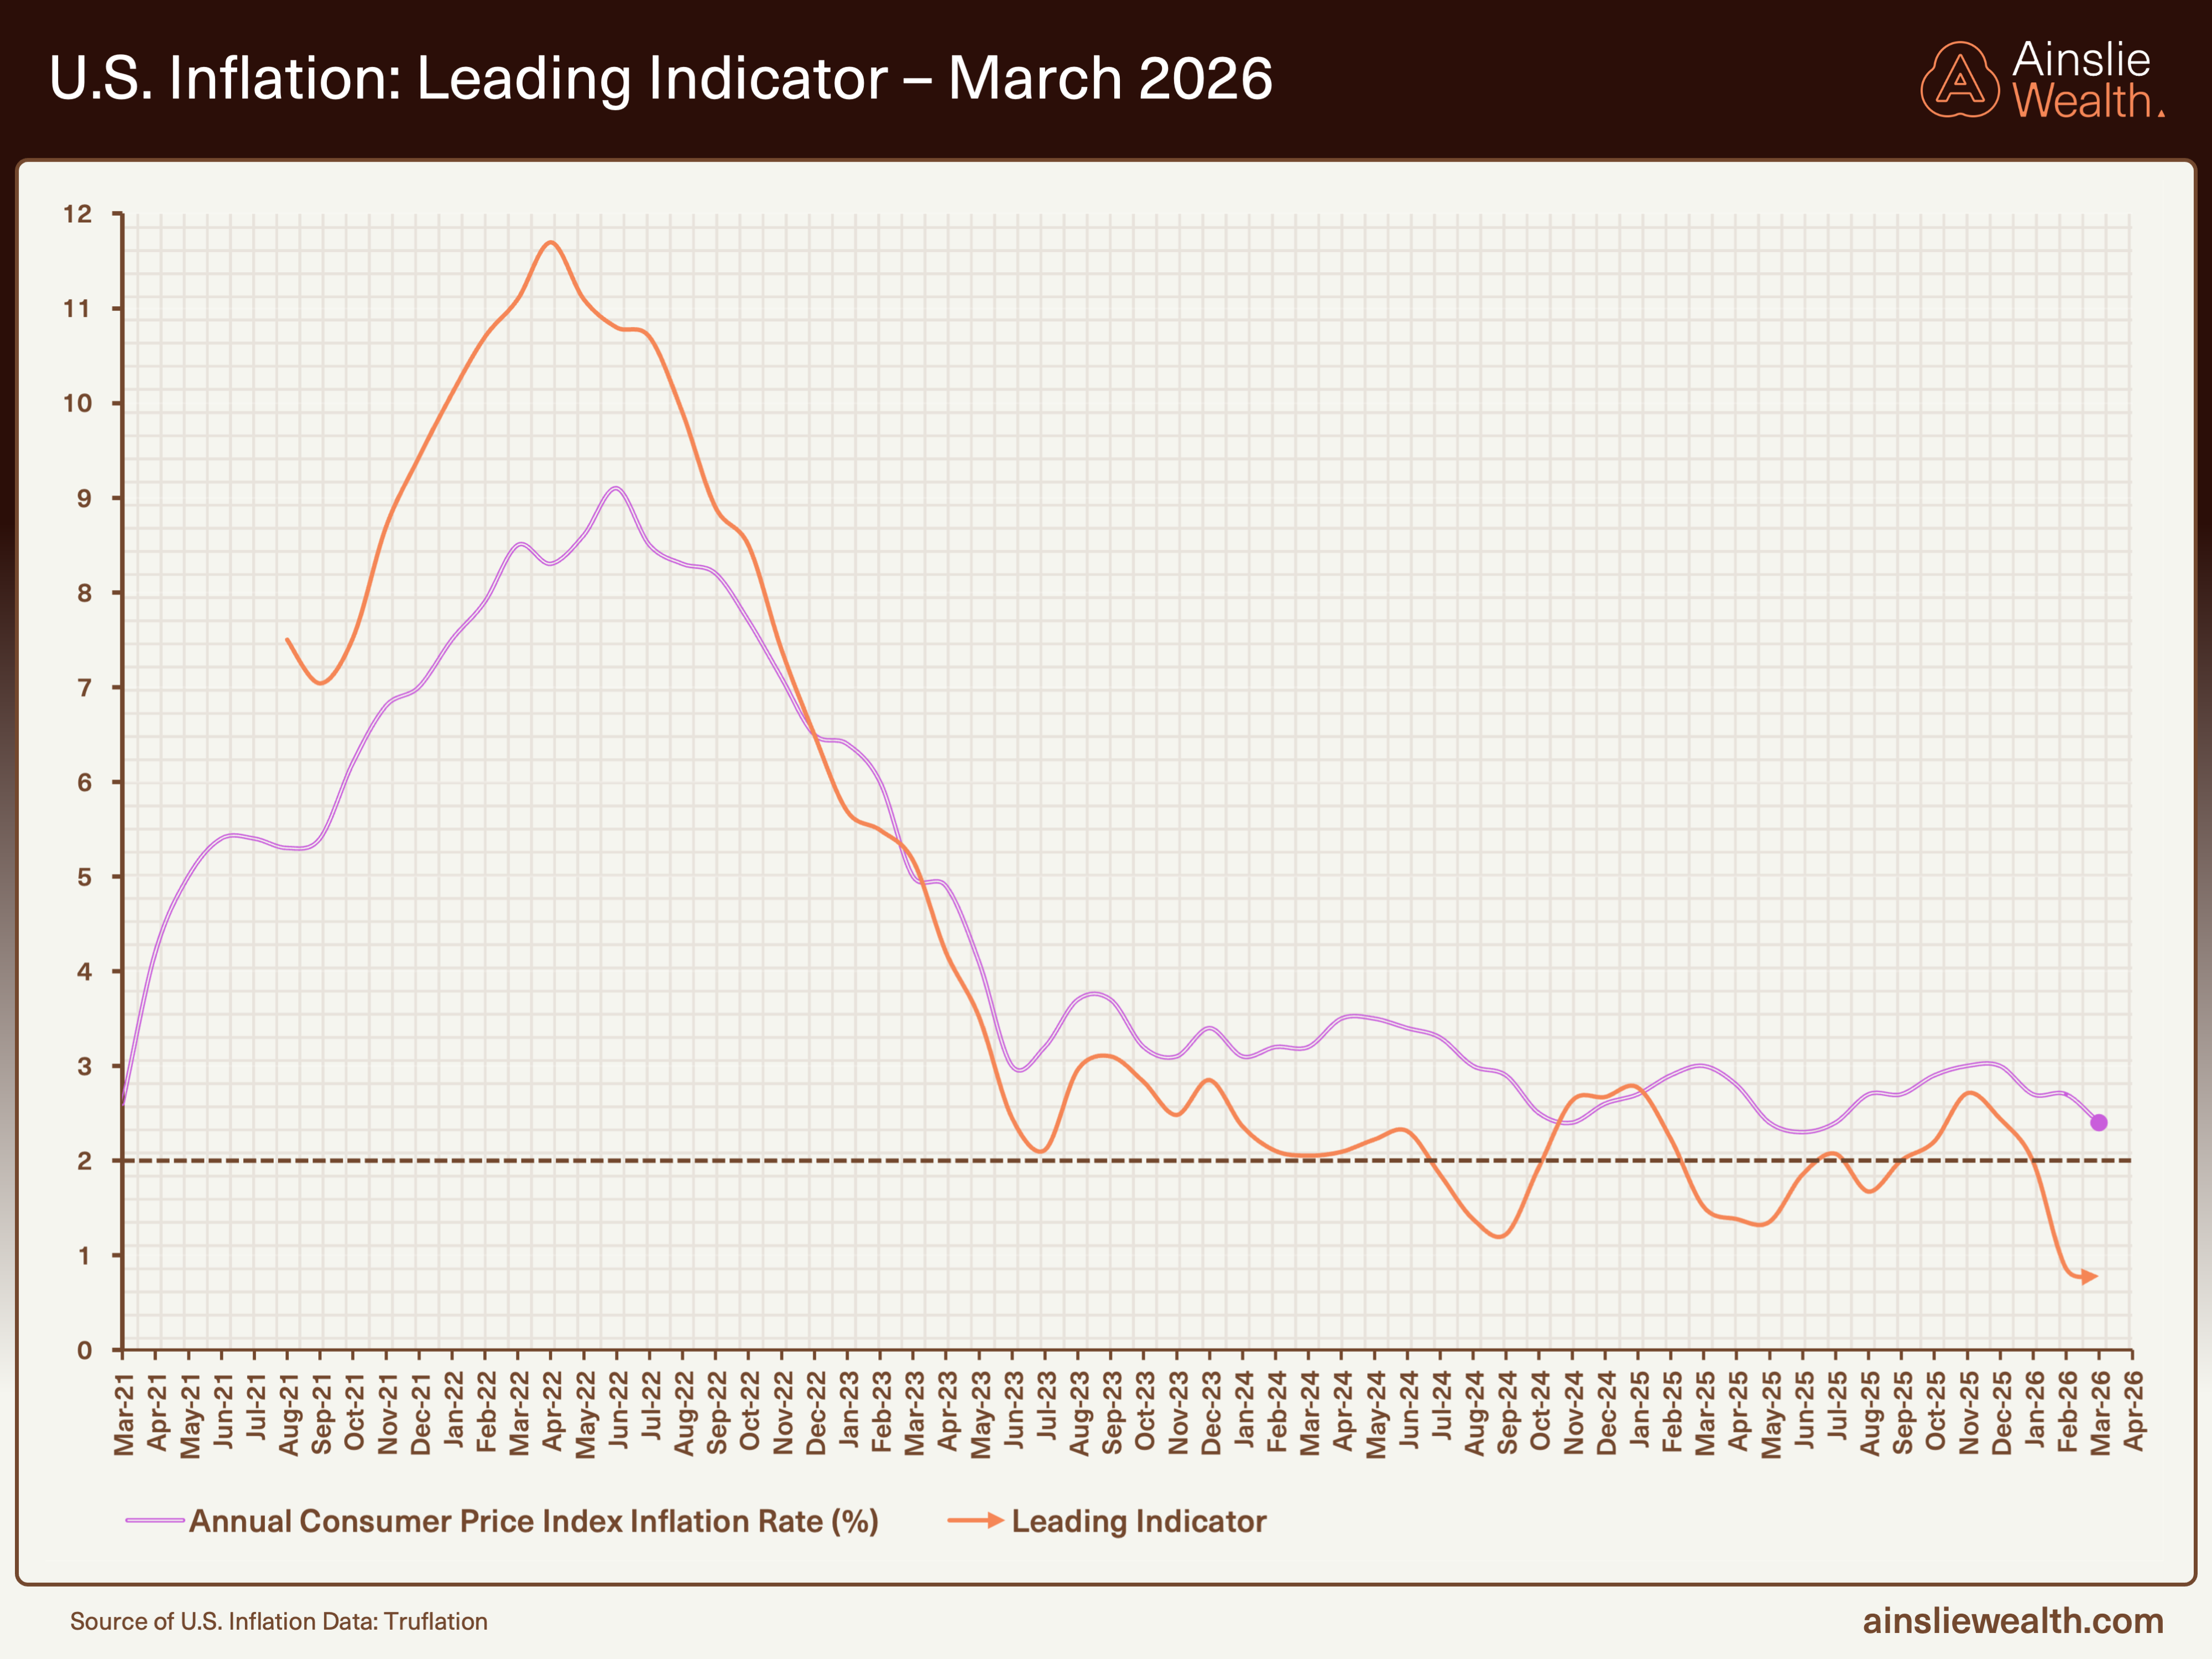
Inflation leading indicator has plunged to ~0.8%. CPI at 2.4%. If the historical lead time holds, official inflation should follow this trajectory sharply lower.
The inflation picture is defined by a widening gap. The leading indicator has plunged to approximately 0.8%, projecting official CPI (currently 2.4%) sharply lower in coming months. If the historical lead time holds, CPI could approach or cross below the Fed’s 2% target. But the leading indicator captures structural disinflationary forces, principally AI-driven cost compression, while geopolitical disruption continues to push input costs higher through energy prices. This tension limits the Fed’s room to cut aggressively even as headline numbers improve.
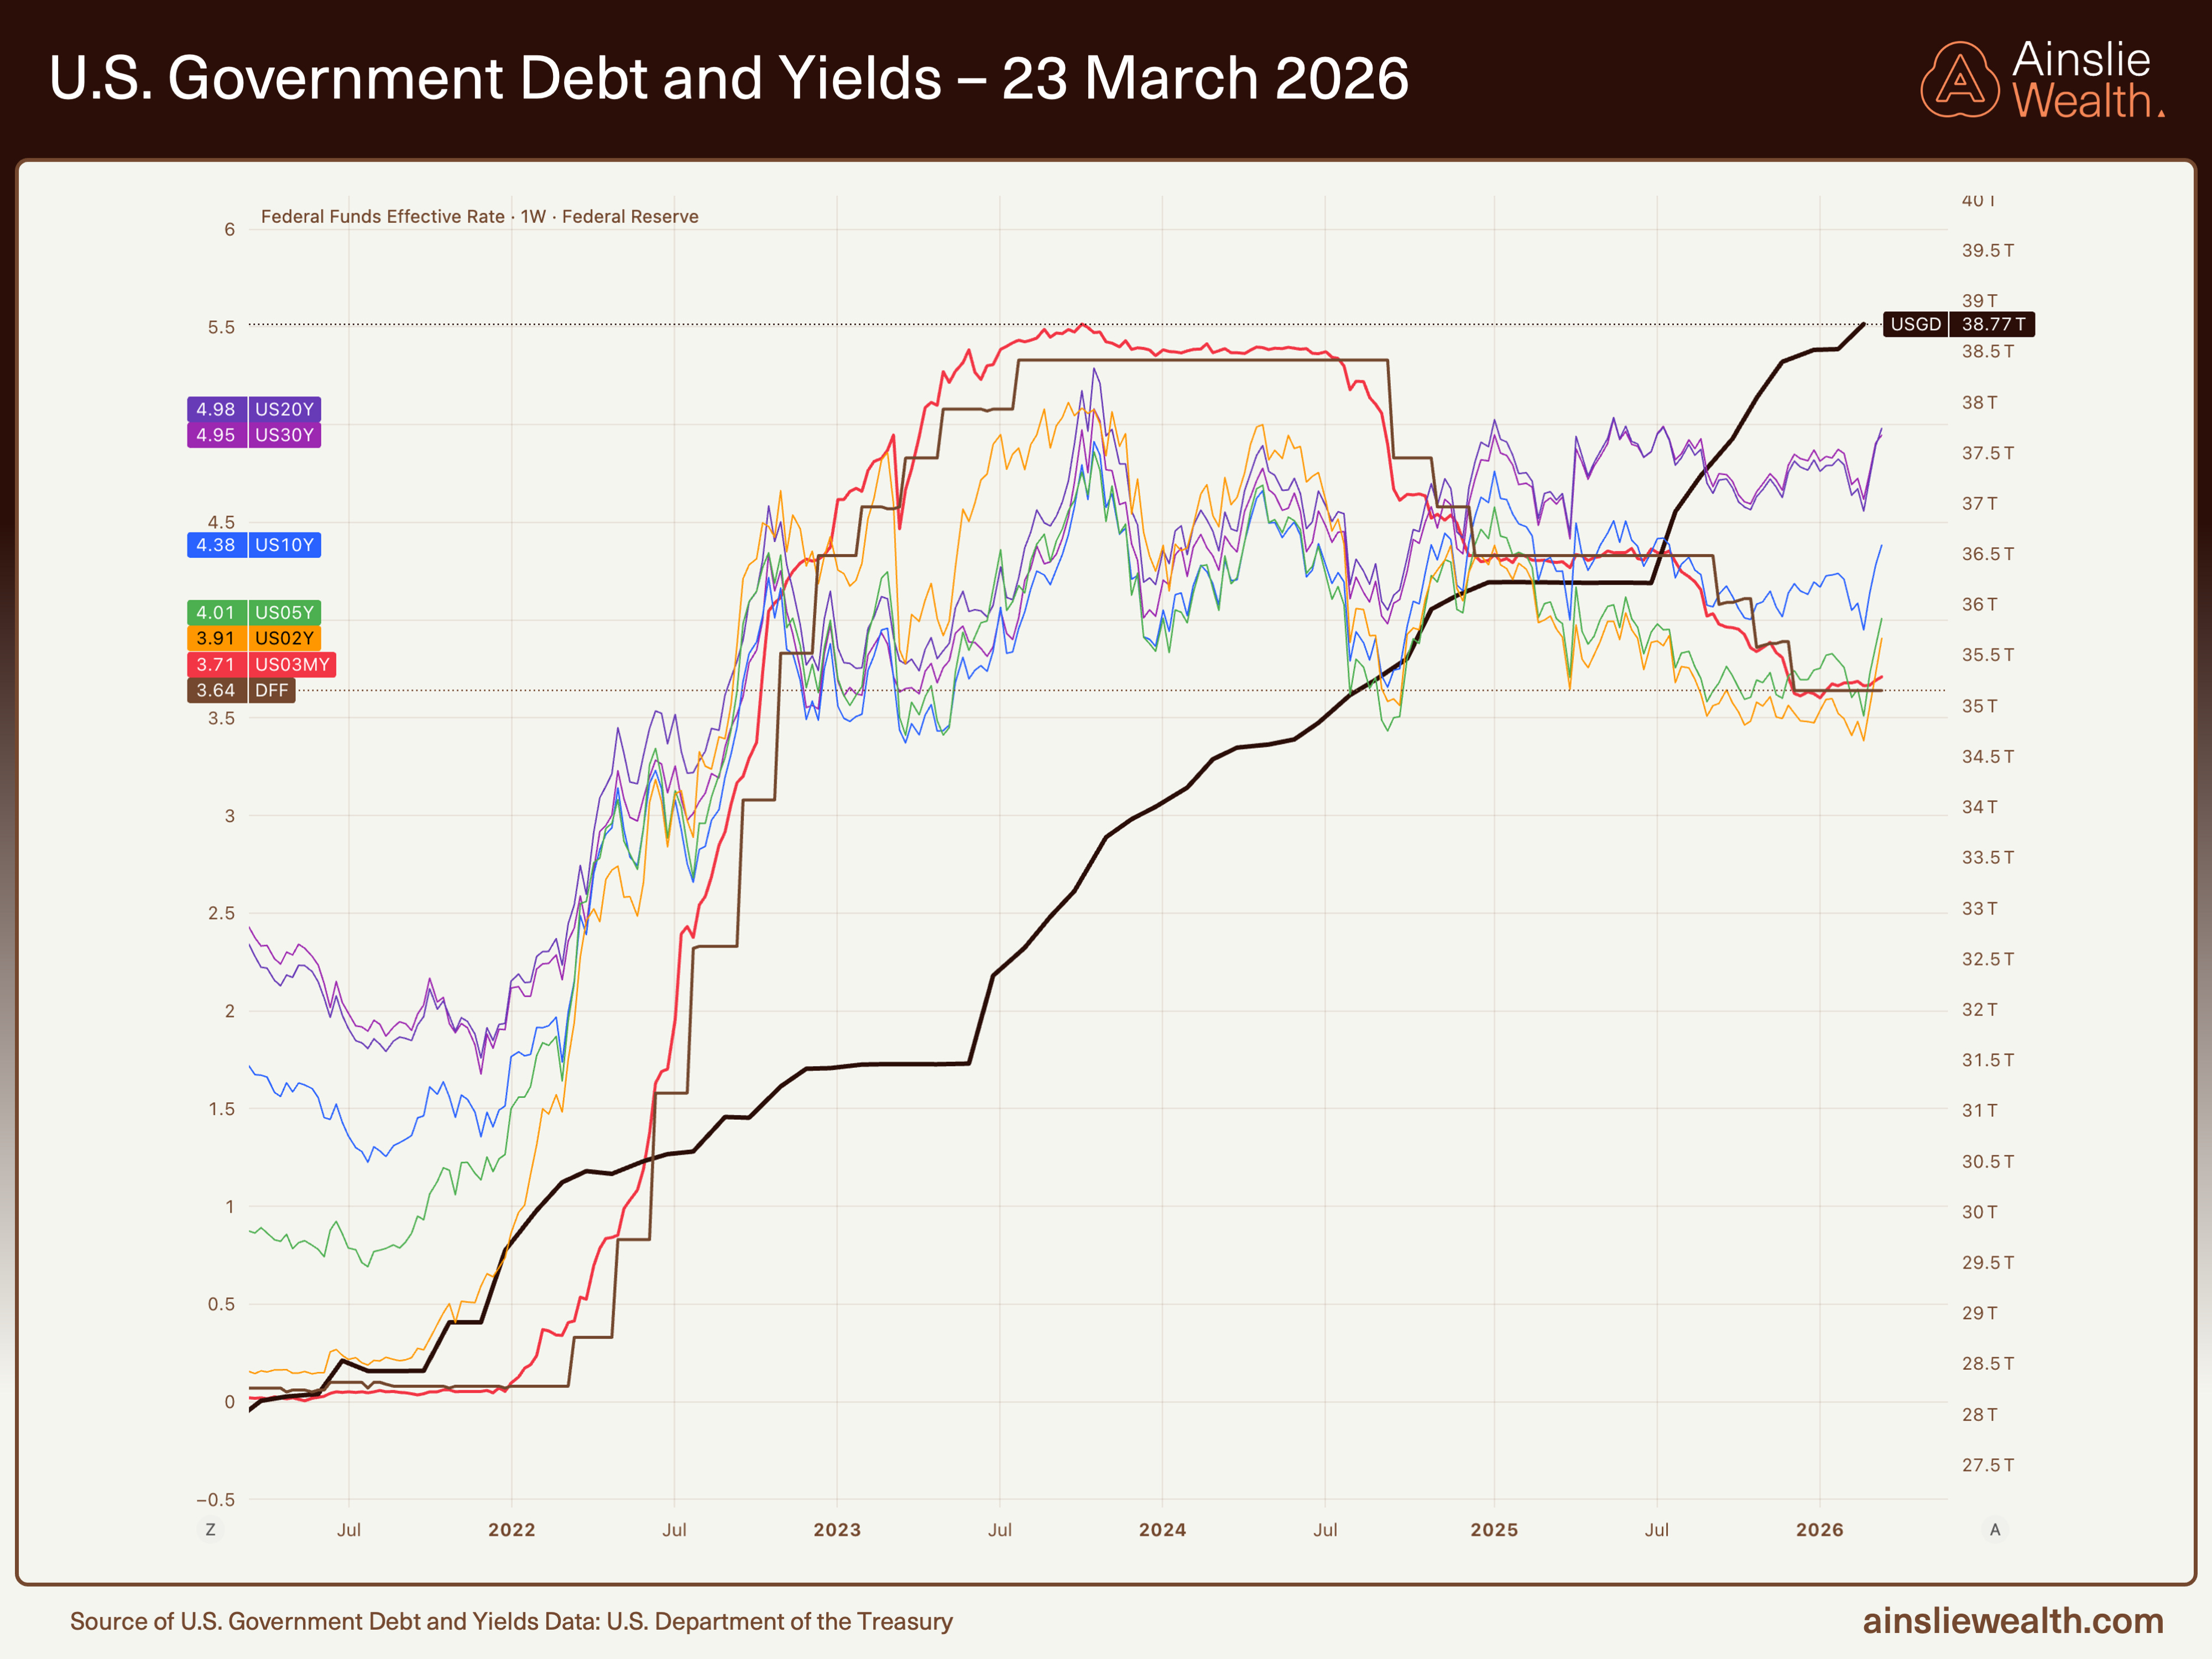
Government debt at $38.77T. Yield curve normalised: 20Y at 4.98%, 30Y at 4.95%, 10Y at 4.38%, 5Y at 4.01%, 2Y at 3.91%, 3M at 3.71%, Fed Funds at 3.64%.
Government debt remains at $38.77 trillion. The yield curve tells a consistent story: the short end sits just above the Fed Funds rate of 3.64%, while the 20-year at 4.98% and 30-year at 4.95% demand significantly more compensation for duration risk. The minor inversion between the 20-year and 30-year (3 basis points) is worth noting: the market is pricing slightly more risk into the 20-year maturity than the 30-year, suggesting near-term fiscal uncertainty rather than long-term solvency concern. The broader message is unchanged: short-term rates have limited room to fall further, and the cost of lending to the government for decades continues to rise.
6: The View Ahead
The GLI at 43.8 places us in the declining phase of the liquidity cycle, past the AI Boom peak and tracking toward a projected trough in late 2027. The pattern has repeated since 1970. Each trough has been followed by a structural rally in hard assets. The question is not whether the cycle turns but when, and how to position through the decline.
Three dynamics warrant close attention. First, the MOVE index has surged to 108.8. Last week’s crossing of 90 was a warning; this week’s reading confirms the collateral channel is now actively tightening. If bond volatility continues to rise, the compounding effect on liquidity could accelerate the deceleration beyond what the GLI currently projects. Second, the dollar at 99.5 has fallen below 100 for the first time in this move; sustained weakness would provide a partial offset to the collateral tightening, while a reversal back above 100 would compound it. Third, nominal global liquidity has begun to ease from its peak. The distinction between a static floor and a declining floor matters enormously for risk asset pricing.
The architecture has not changed. We are in a phase transition: the slow-moving shift from a financial system built on trust in institutions to one built on the functional properties of the assets themselves. This week’s sharp corrections in gold and silver are noise within that structural transition. Sovereign debt rises while currencies depreciate. Central banks accumulate gold while cutting rates. Bond volatility tightens collateral while the real economy absorbs liquidity. These contradictions are not anomalies. They are the transition.
Position for the structure. The noise will pass.
Reference: Core Thesis
Global liquidity sits at structural highs. Momentum does not. Floor without impulse. Nominal liquidity supports risk assets, but the rate of change has turned decisively lower with a projected trough extending into late 2027. What matters for pricing is not the pool but its movement. Geopolitical disruption to oil markets compounds the deceleration, with each $10/bbl rise draining approximately 1.5 points from the Global Liquidity Index.
The cause is not central bank tightening. Central banks remain broadly accommodative. The cause is diversion: a strengthening global economy channels capital into productive uses, principally hyperscaler capex and AI infrastructure. Private balance sheets absorb monetary energy that previously amplified financial asset reflexivity. The same investment compresses white-collar labour, eroding the professional spending layer that historically sustained consumer momentum. Tightening creates a falling floor. Productive absorption creates a static floor with no propulsive force above it, and now weakening demand beneath it.
We have reached peak stimulus. Policy reversals in Japan and Australia signal the easing cycle’s ceiling. Every rate cut from here confirms the limits of monetary support rather than its potency. In the U.S., the shift from Fed QE to Treasury QE redirects liquidity toward the real economy. Rising bond volatility compounds the effect: larger collateral haircuts reduce the multiplier that converts collateral into new liquidity, making the tightening self-reinforcing. Private credit default rates at 9.2% and tightening redemption constraints confirm the downturn is no longer theoretical. The backstop for risk assets is narrowing in a way that changes future rallies.
The global liquidity bifurcation deepens. China’s PBoC continues aggressive easing to monetise structural debt overhangs. This liquidity flows overwhelmingly toward gold through official reserve accumulation and encouraged private buying. Western central banks accumulate gold not as an inflation hedge but as neutral reserve collateral amid widening uncertainty in sovereign credit outcomes. Gold responds to volatility in real rates, not their level. Corrections consolidate rather than reverse.
Silver follows as hybrid constraint. Industrial demand collides with monetary function at depleted inventories sitting at multi-decade lows. Price discovery tracks necessity rather than narrative.
Bitcoin’s current weakness reflects recalibration, not thesis failure. Liquidity models correctly identify near-term headwinds but capture neither structural supply compression nor growing sovereign demand for settlement neutrality. The asset reprices to decelerating advanced-economy liquidity, but its terminal value is set by adoption curves those models ignore. Structure governs destination; reflexivity governs route. Accumulation through weakness remains framework-consistent.
This is a phase transition: widening uncertainty in sovereign credit outcomes drives precautionary diversification; capital migrates to trust-minimised assets; financial infrastructure bifurcates between legacy and on-chain systems; rupture points ignite exit velocity into hard money. We are past the initial widening but before infrastructure bifurcation becomes visible to consensus.
Positioning reflects the transition. Risk tilts cautious on duration and credit, constructive on commodities and energy. Monetary hedges are accumulated as function over promise. The divide ahead is not between asset classes but between structures. Trust-dependent instruments bleed. Function-anchored instruments compound. Liquidity informs timing. Trust repricing dictates allocation.
Appendix Charts
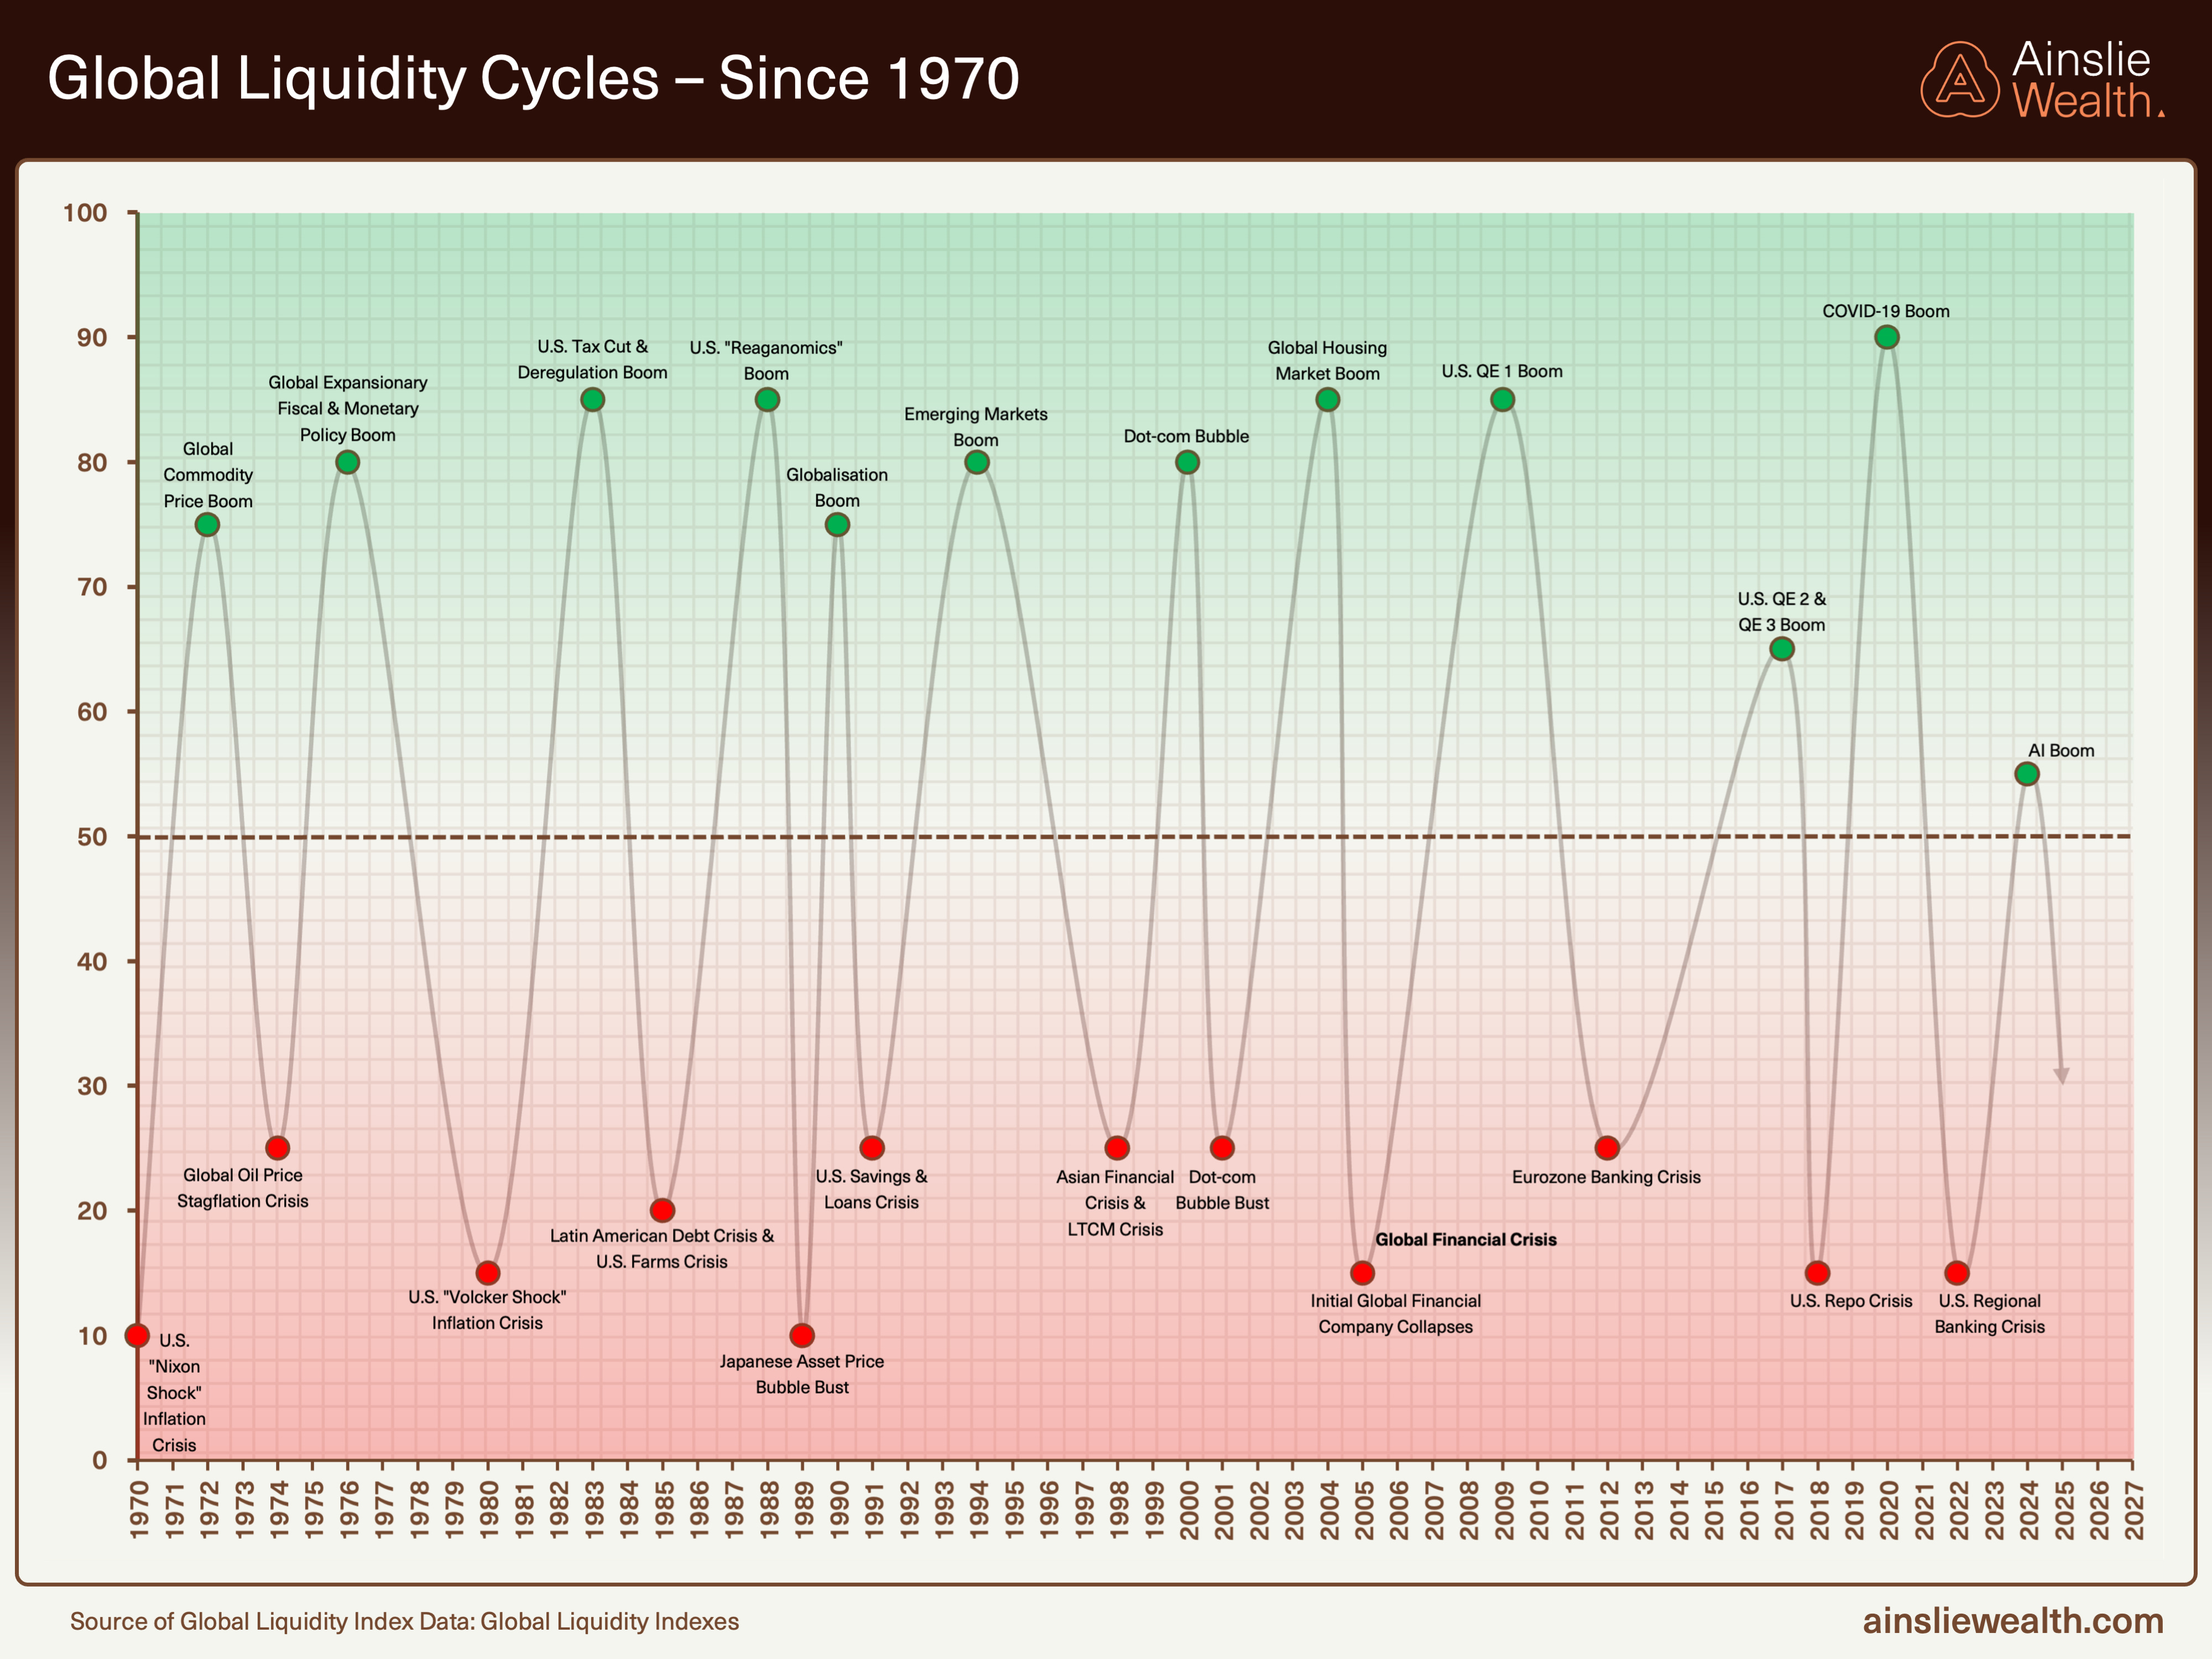
The long view: global liquidity cycles since 1970. Each trough has been followed by a structural expansion carrying hard assets to new highs. Current position: past the “AI Boom” peak at ~55, tracking toward the projected trough.
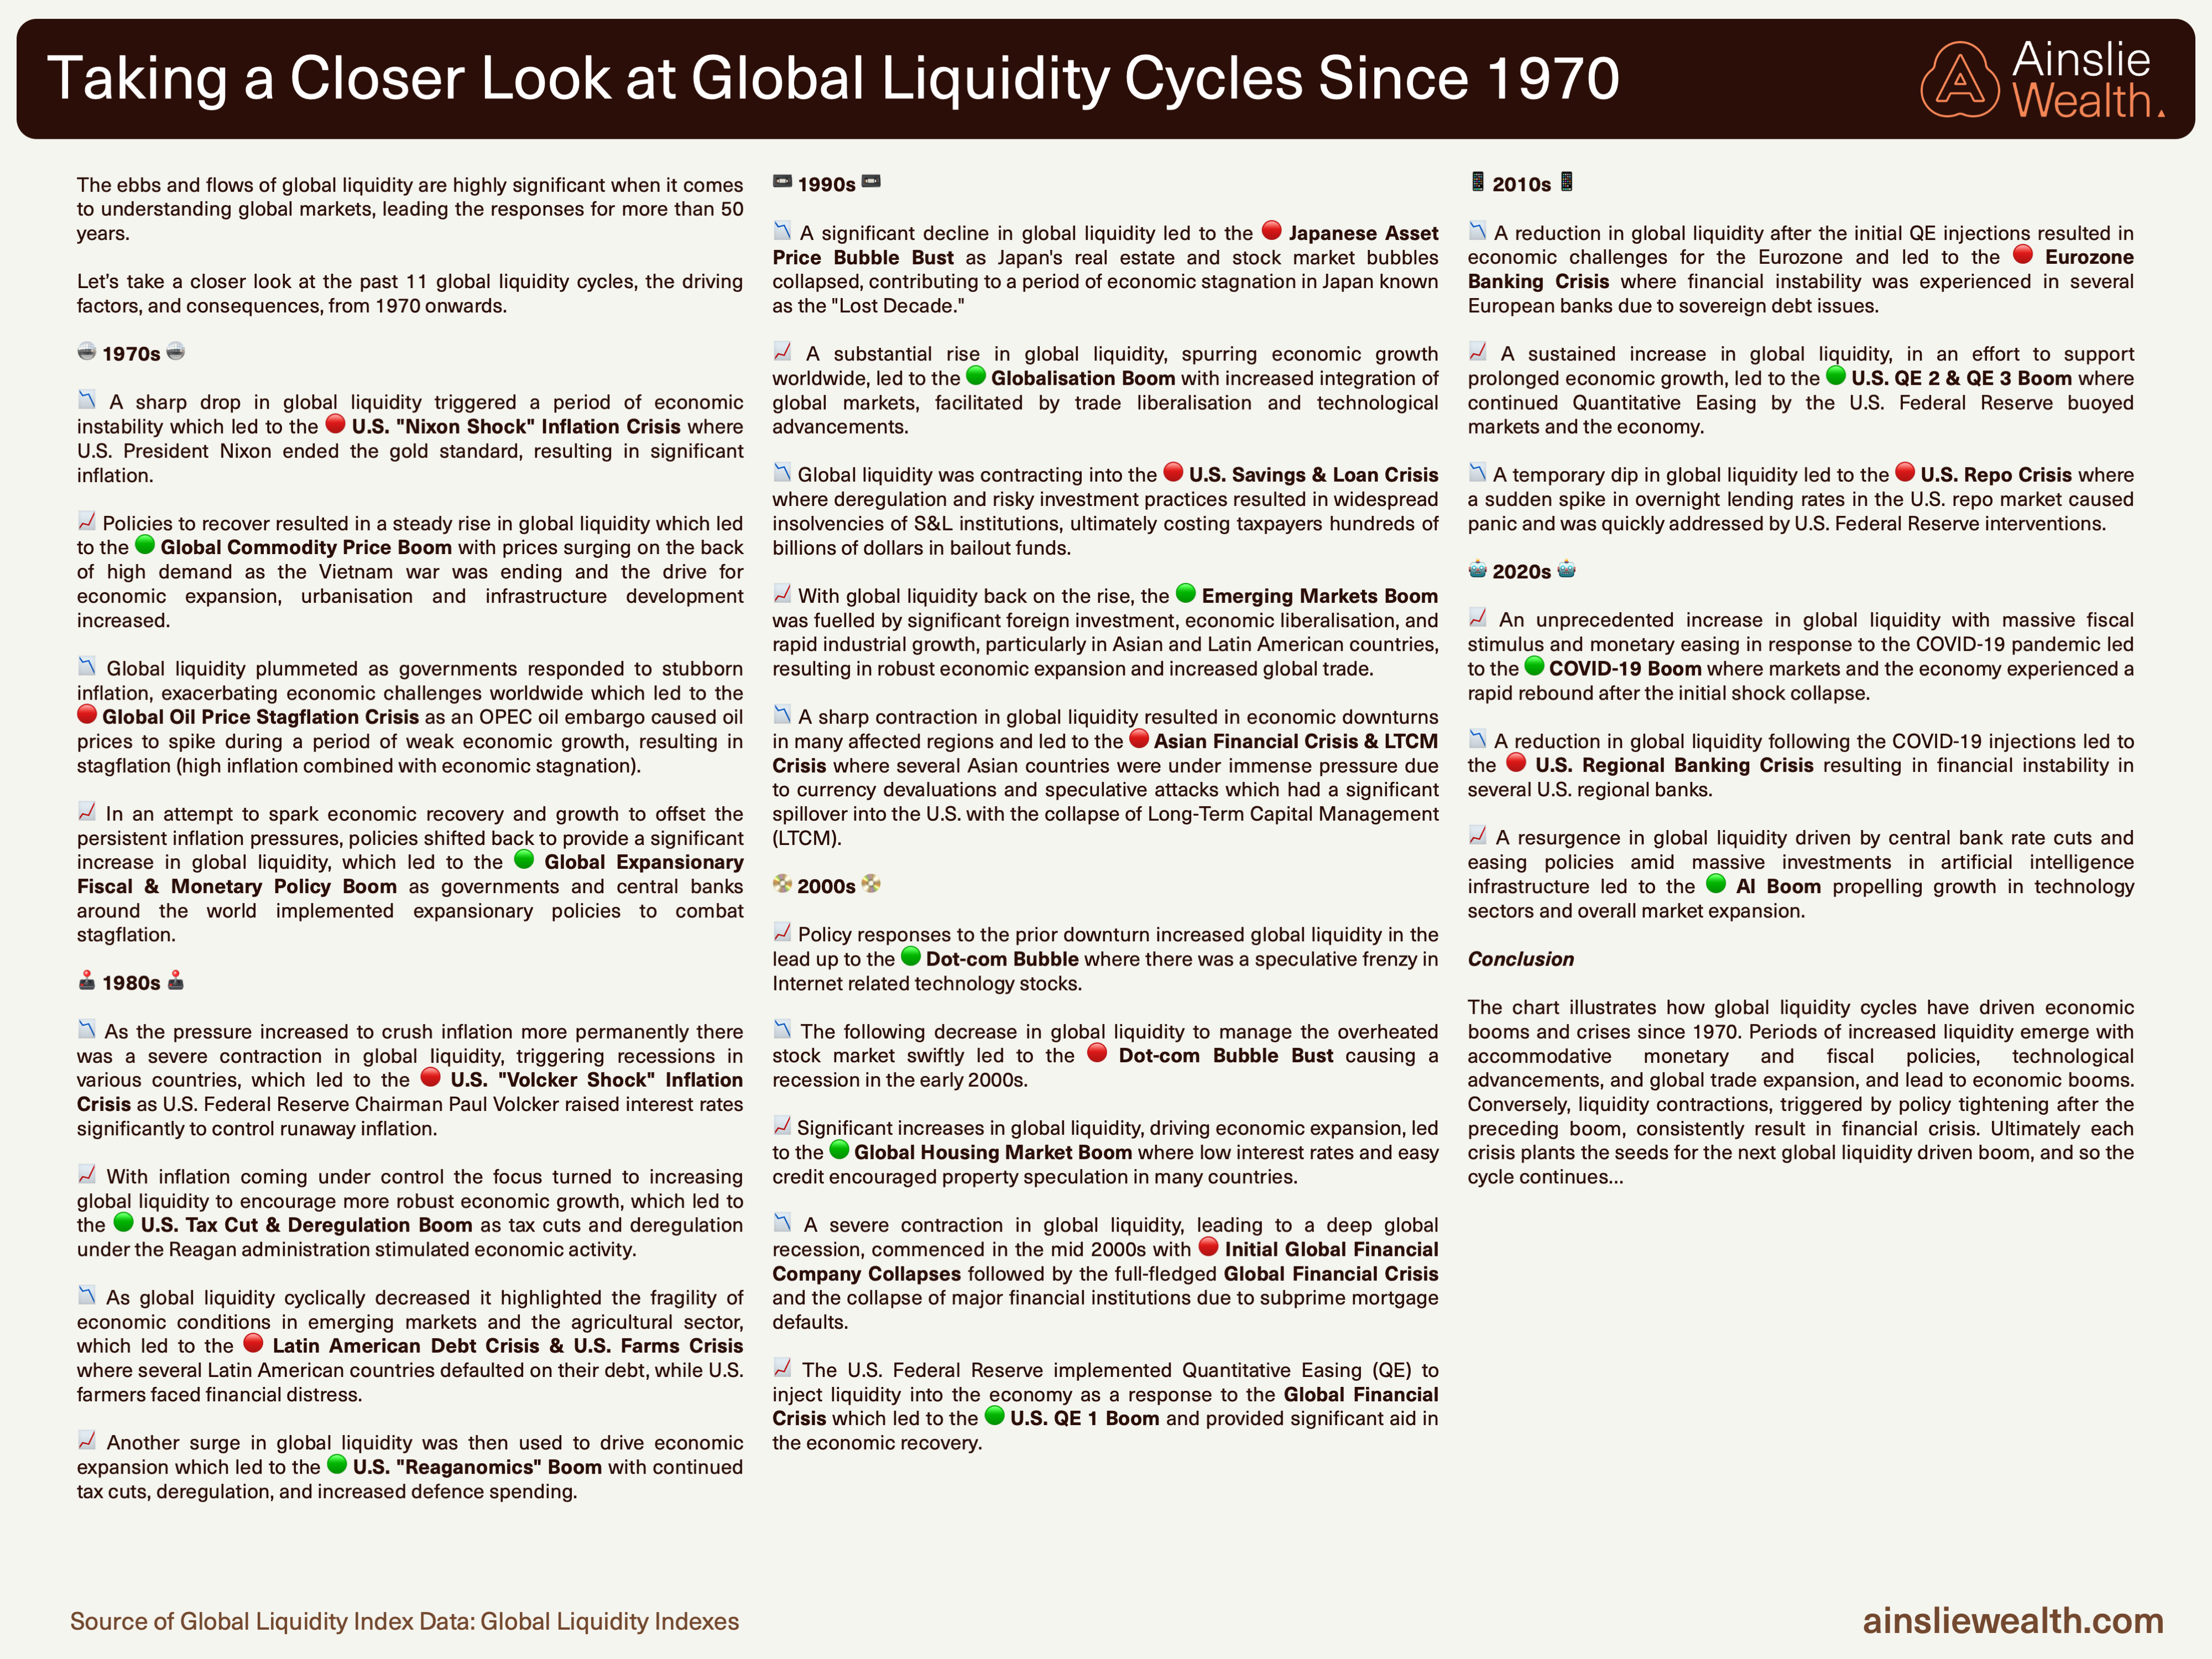
12 boom-bust cycles since the 1970s. Each expansion driven by liquidity creation; each contraction triggered by its withdrawal.
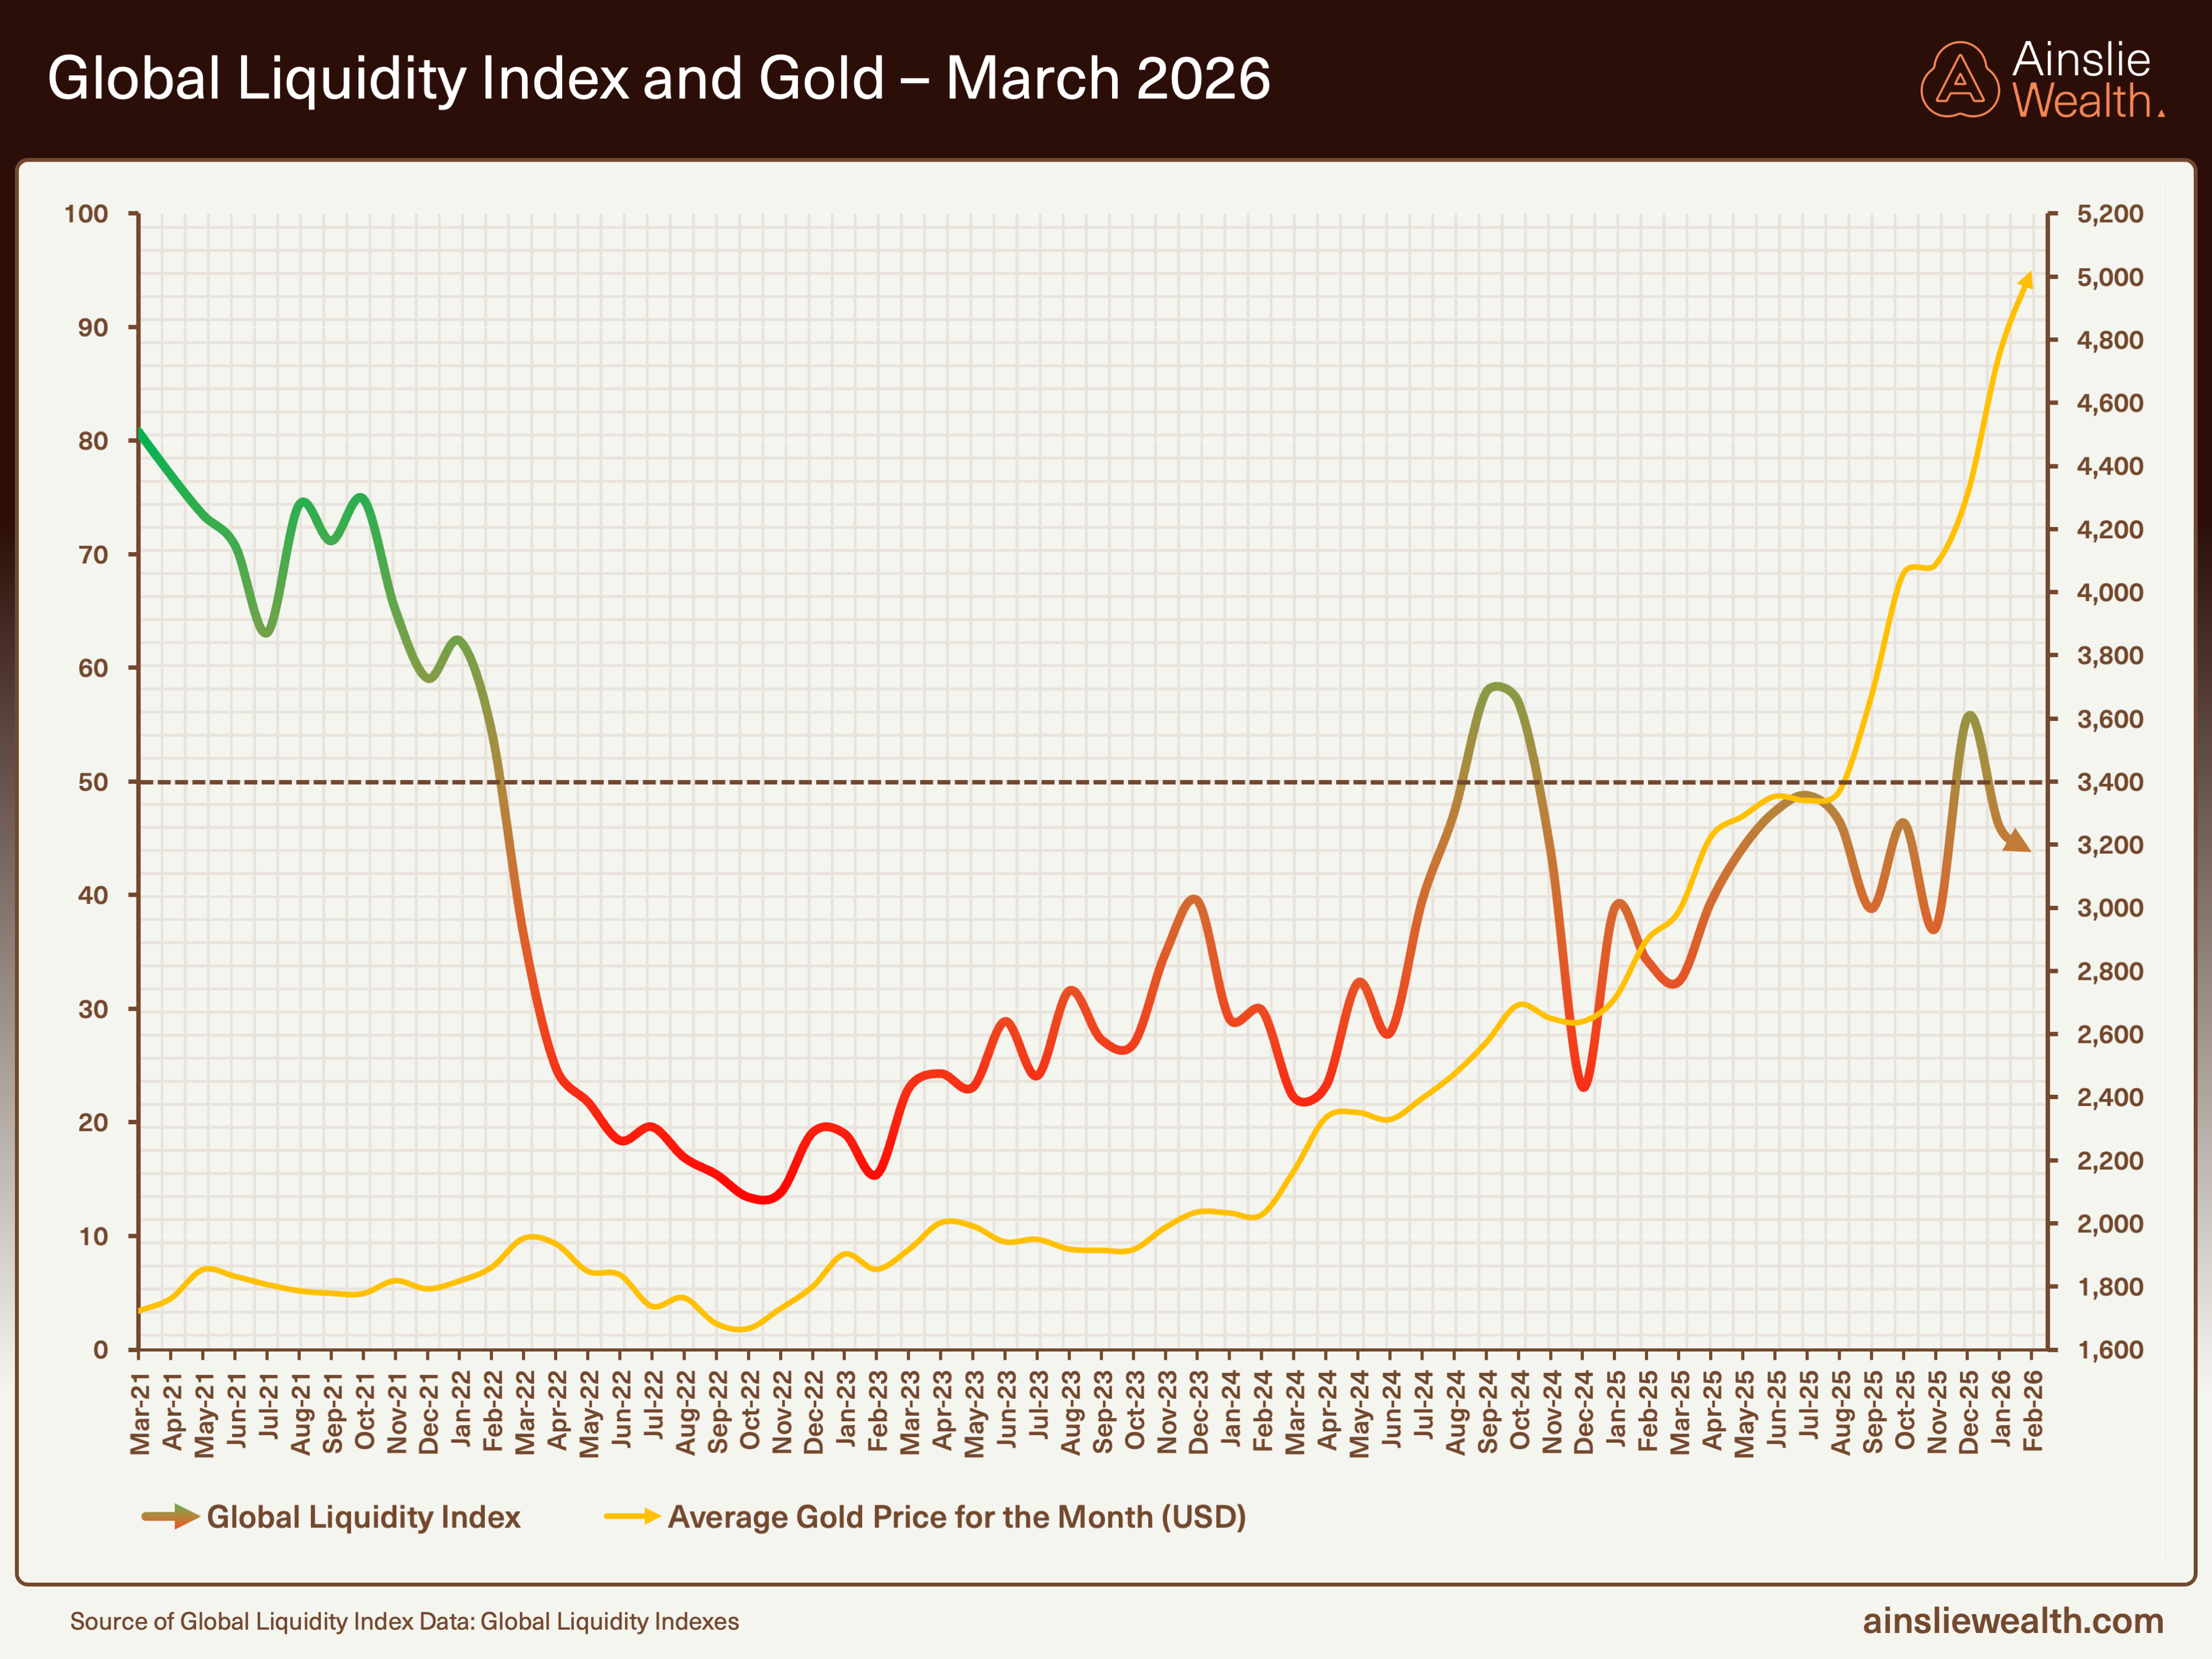
Gold has decoupled sharply upward from the GLI since late 2024, driven by sovereign reserve accumulation. This week’s correction does not close the gap.
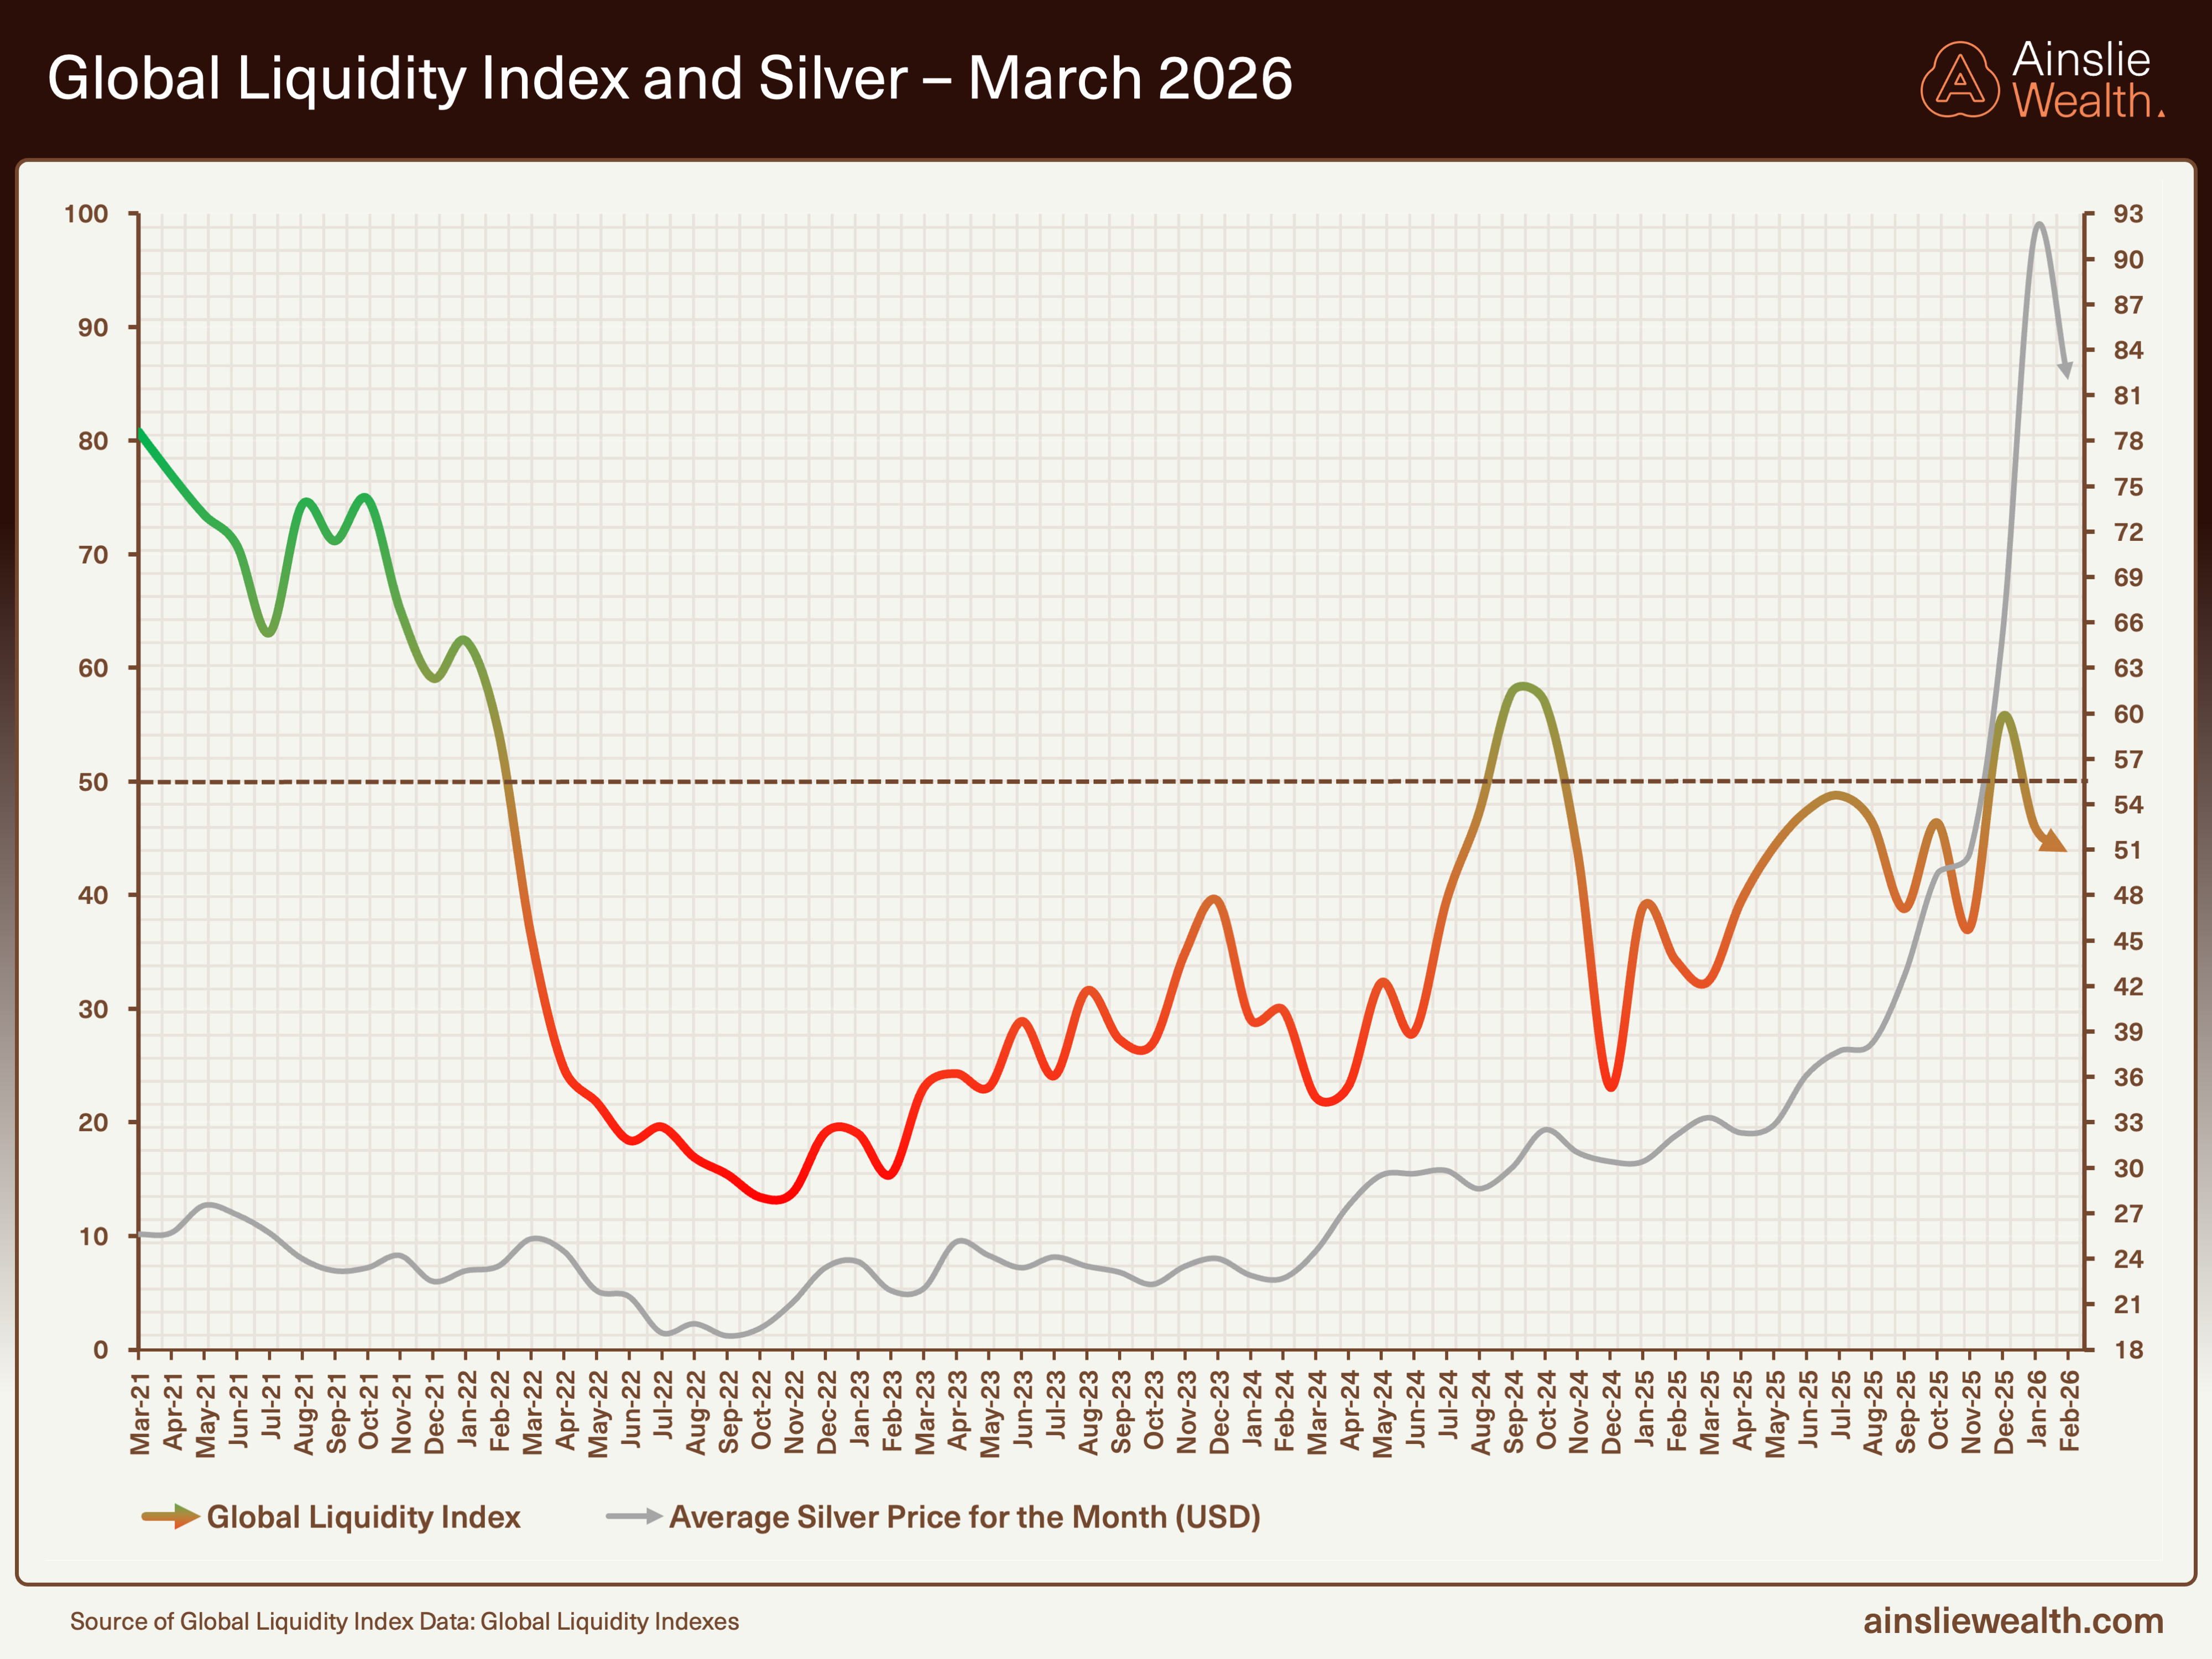
Silver’s surge and correction: the spike to $125 and retreat to $67.90 illustrate reflexivity within a structural repricing.
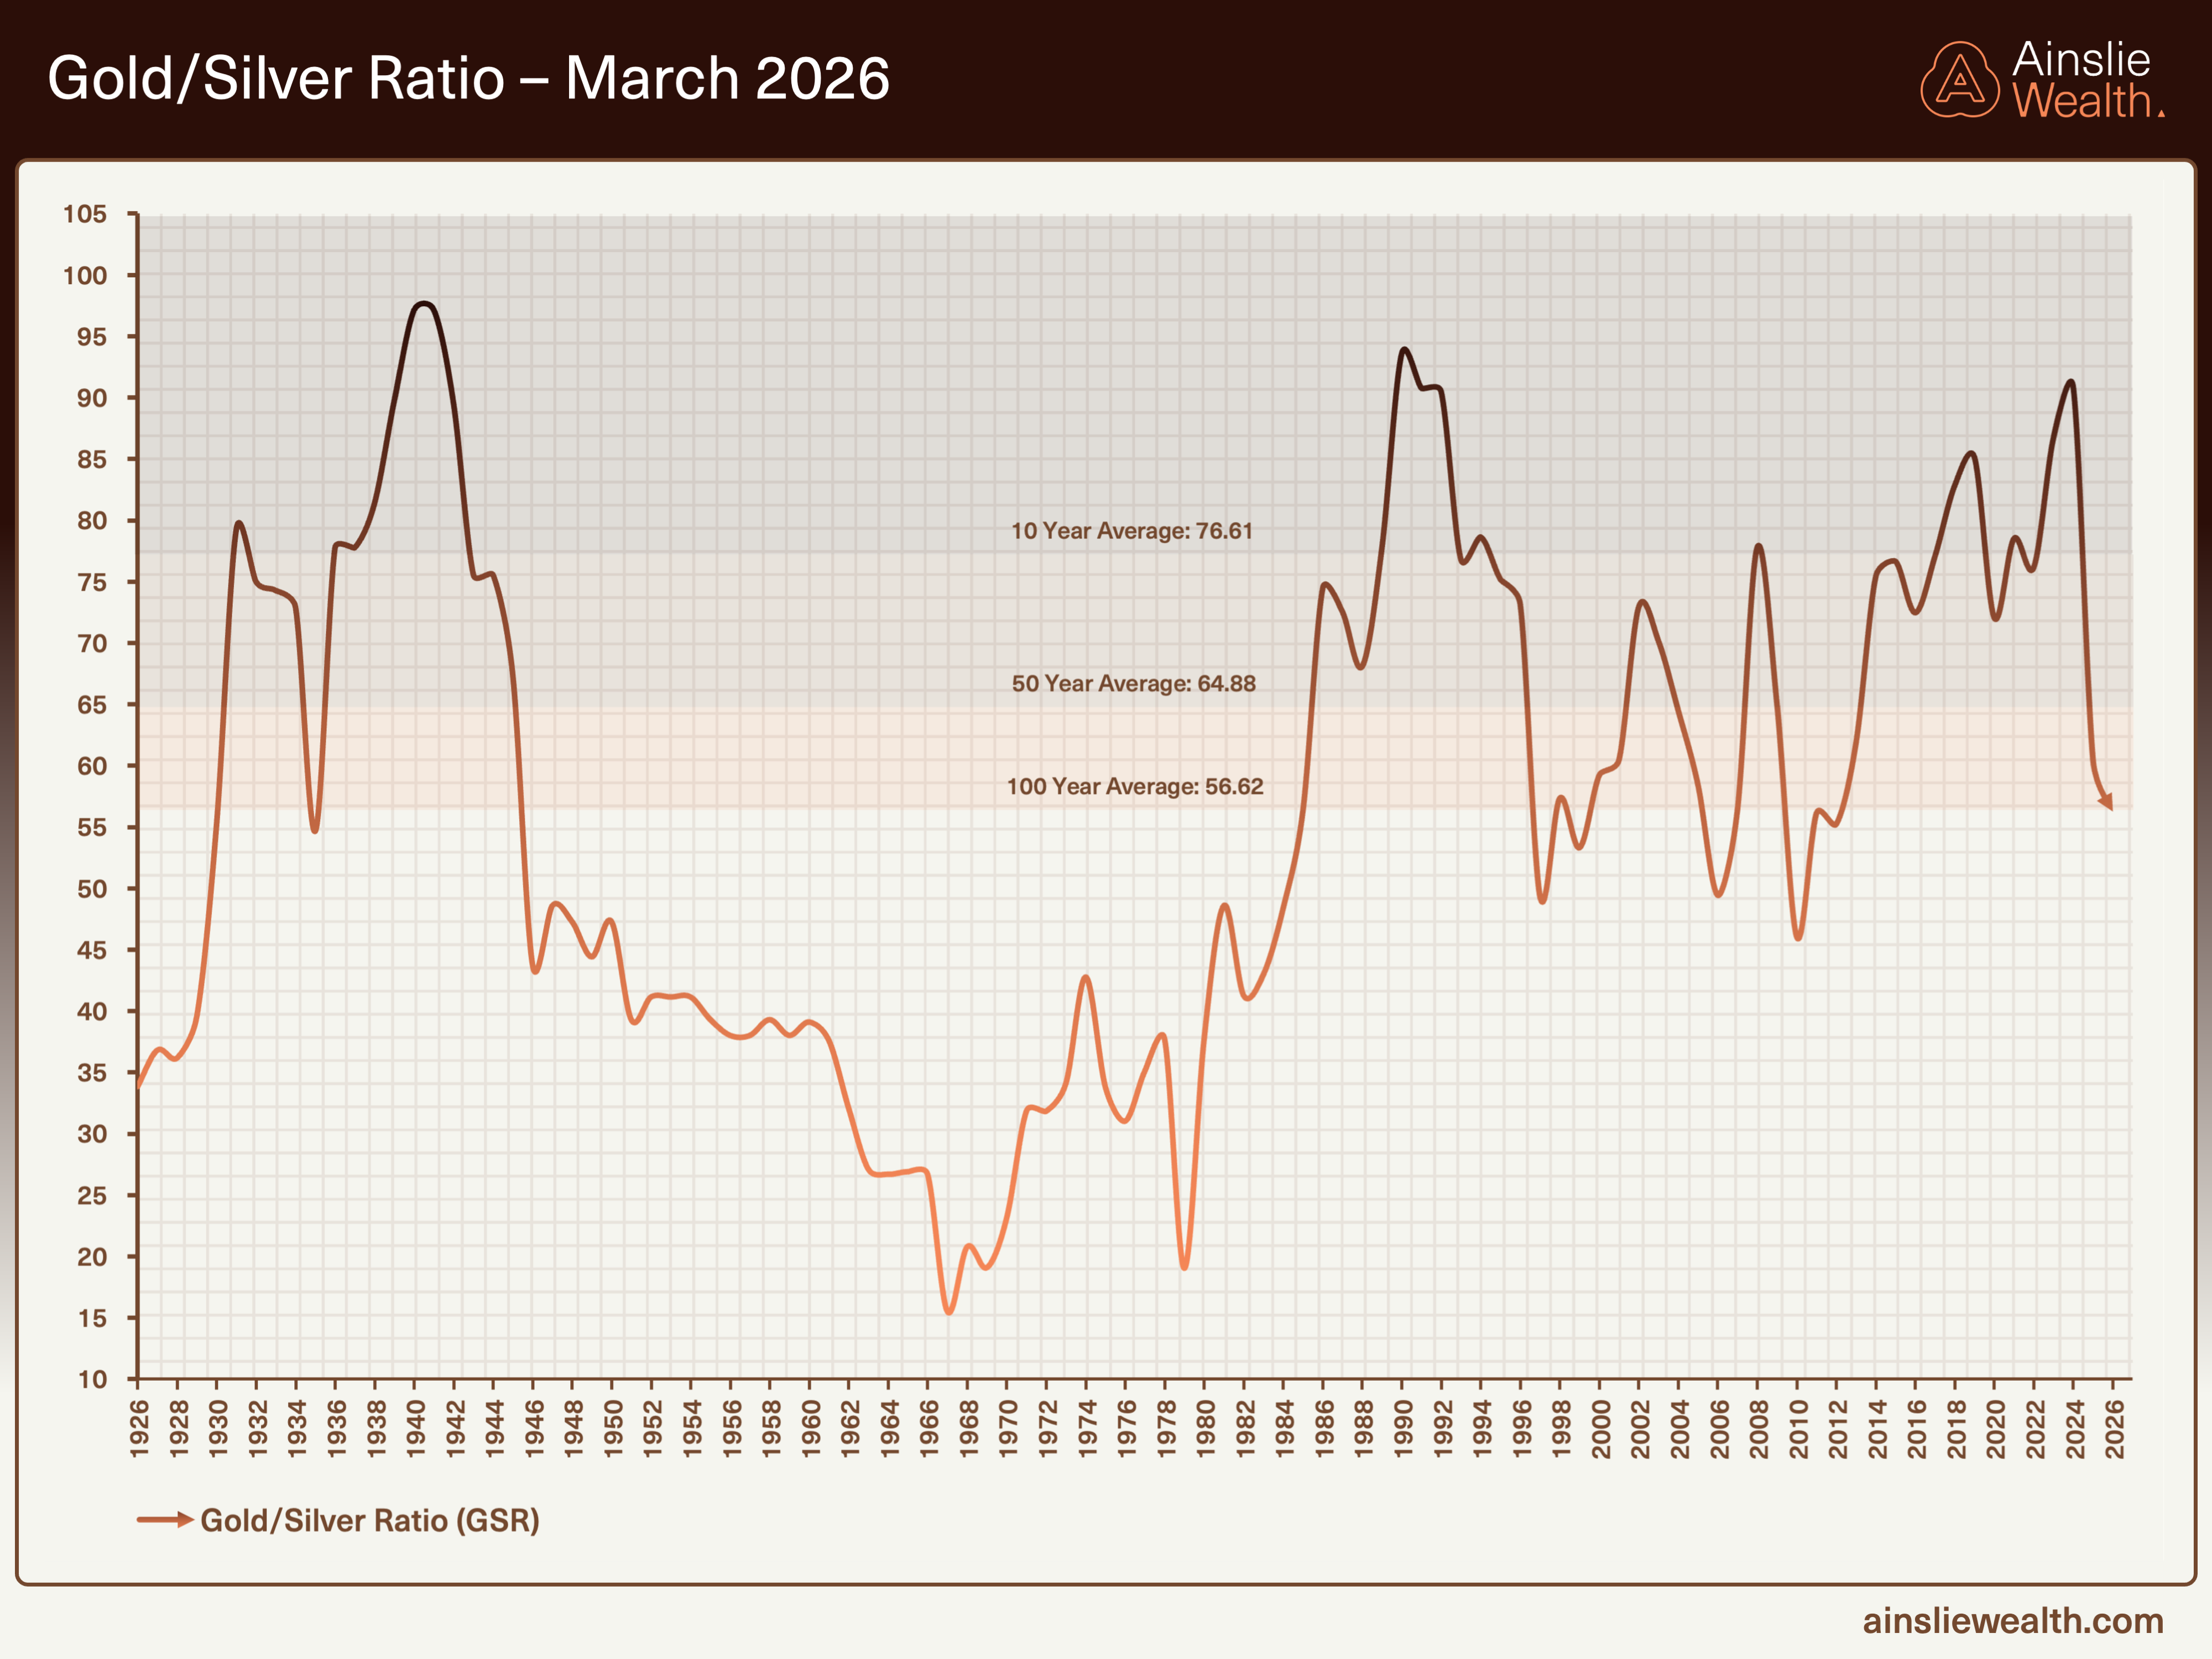
Gold/Silver ratio at 66.2, rising from last week’s 62.28 as silver corrected harder. The ratio remains well below its 10-year average of 76.61 and near the 100-year average of 56.62.
Disclaimer
The information in this report is current as at the date and time of preparation. This report is intended to be used for general informational purposes. It contains general buy/sell recommendations for Bitcoin and Bullion which do not take into account any particular circumstances, objectives or situations. Past performance should not be taken as an indication of future outcomes. You should consider obtaining independent advice before making an investment decision.
We rely on publicly available data, statistics and software from third party sources and our own proprietary analysis to construct the report. We do not warrant the accuracy and completeness of this analysis or the data sourced from third party providers.
Although we exercise care when preparing the report, to the full extent allowed by law, we do not accept any liability at law (including but not limited to under contract, in tort, under statute or otherwise) and fully disclaim any and all liability for loss or damage suffered by you or any other person in connection with the use of the information contained in this report, including any errors or omissions. In no event will we be liable for any special, indirect, incidental, or consequential damages which may be incurred or experienced by a person relying on the contents of this report.
As Chief Economist, I may personally take positions in these markets counter to the general buy/sell recommendations provided, which may or may not be market neutral.