
Support Continues - Capex Drain Meets Plumbing Lift
Nominal liquidity records fresh highs on targeted interventions while the cycle momentum and real-economy absorption confirm late-cycle positioning toward the late-2027 trough.

The Pulse
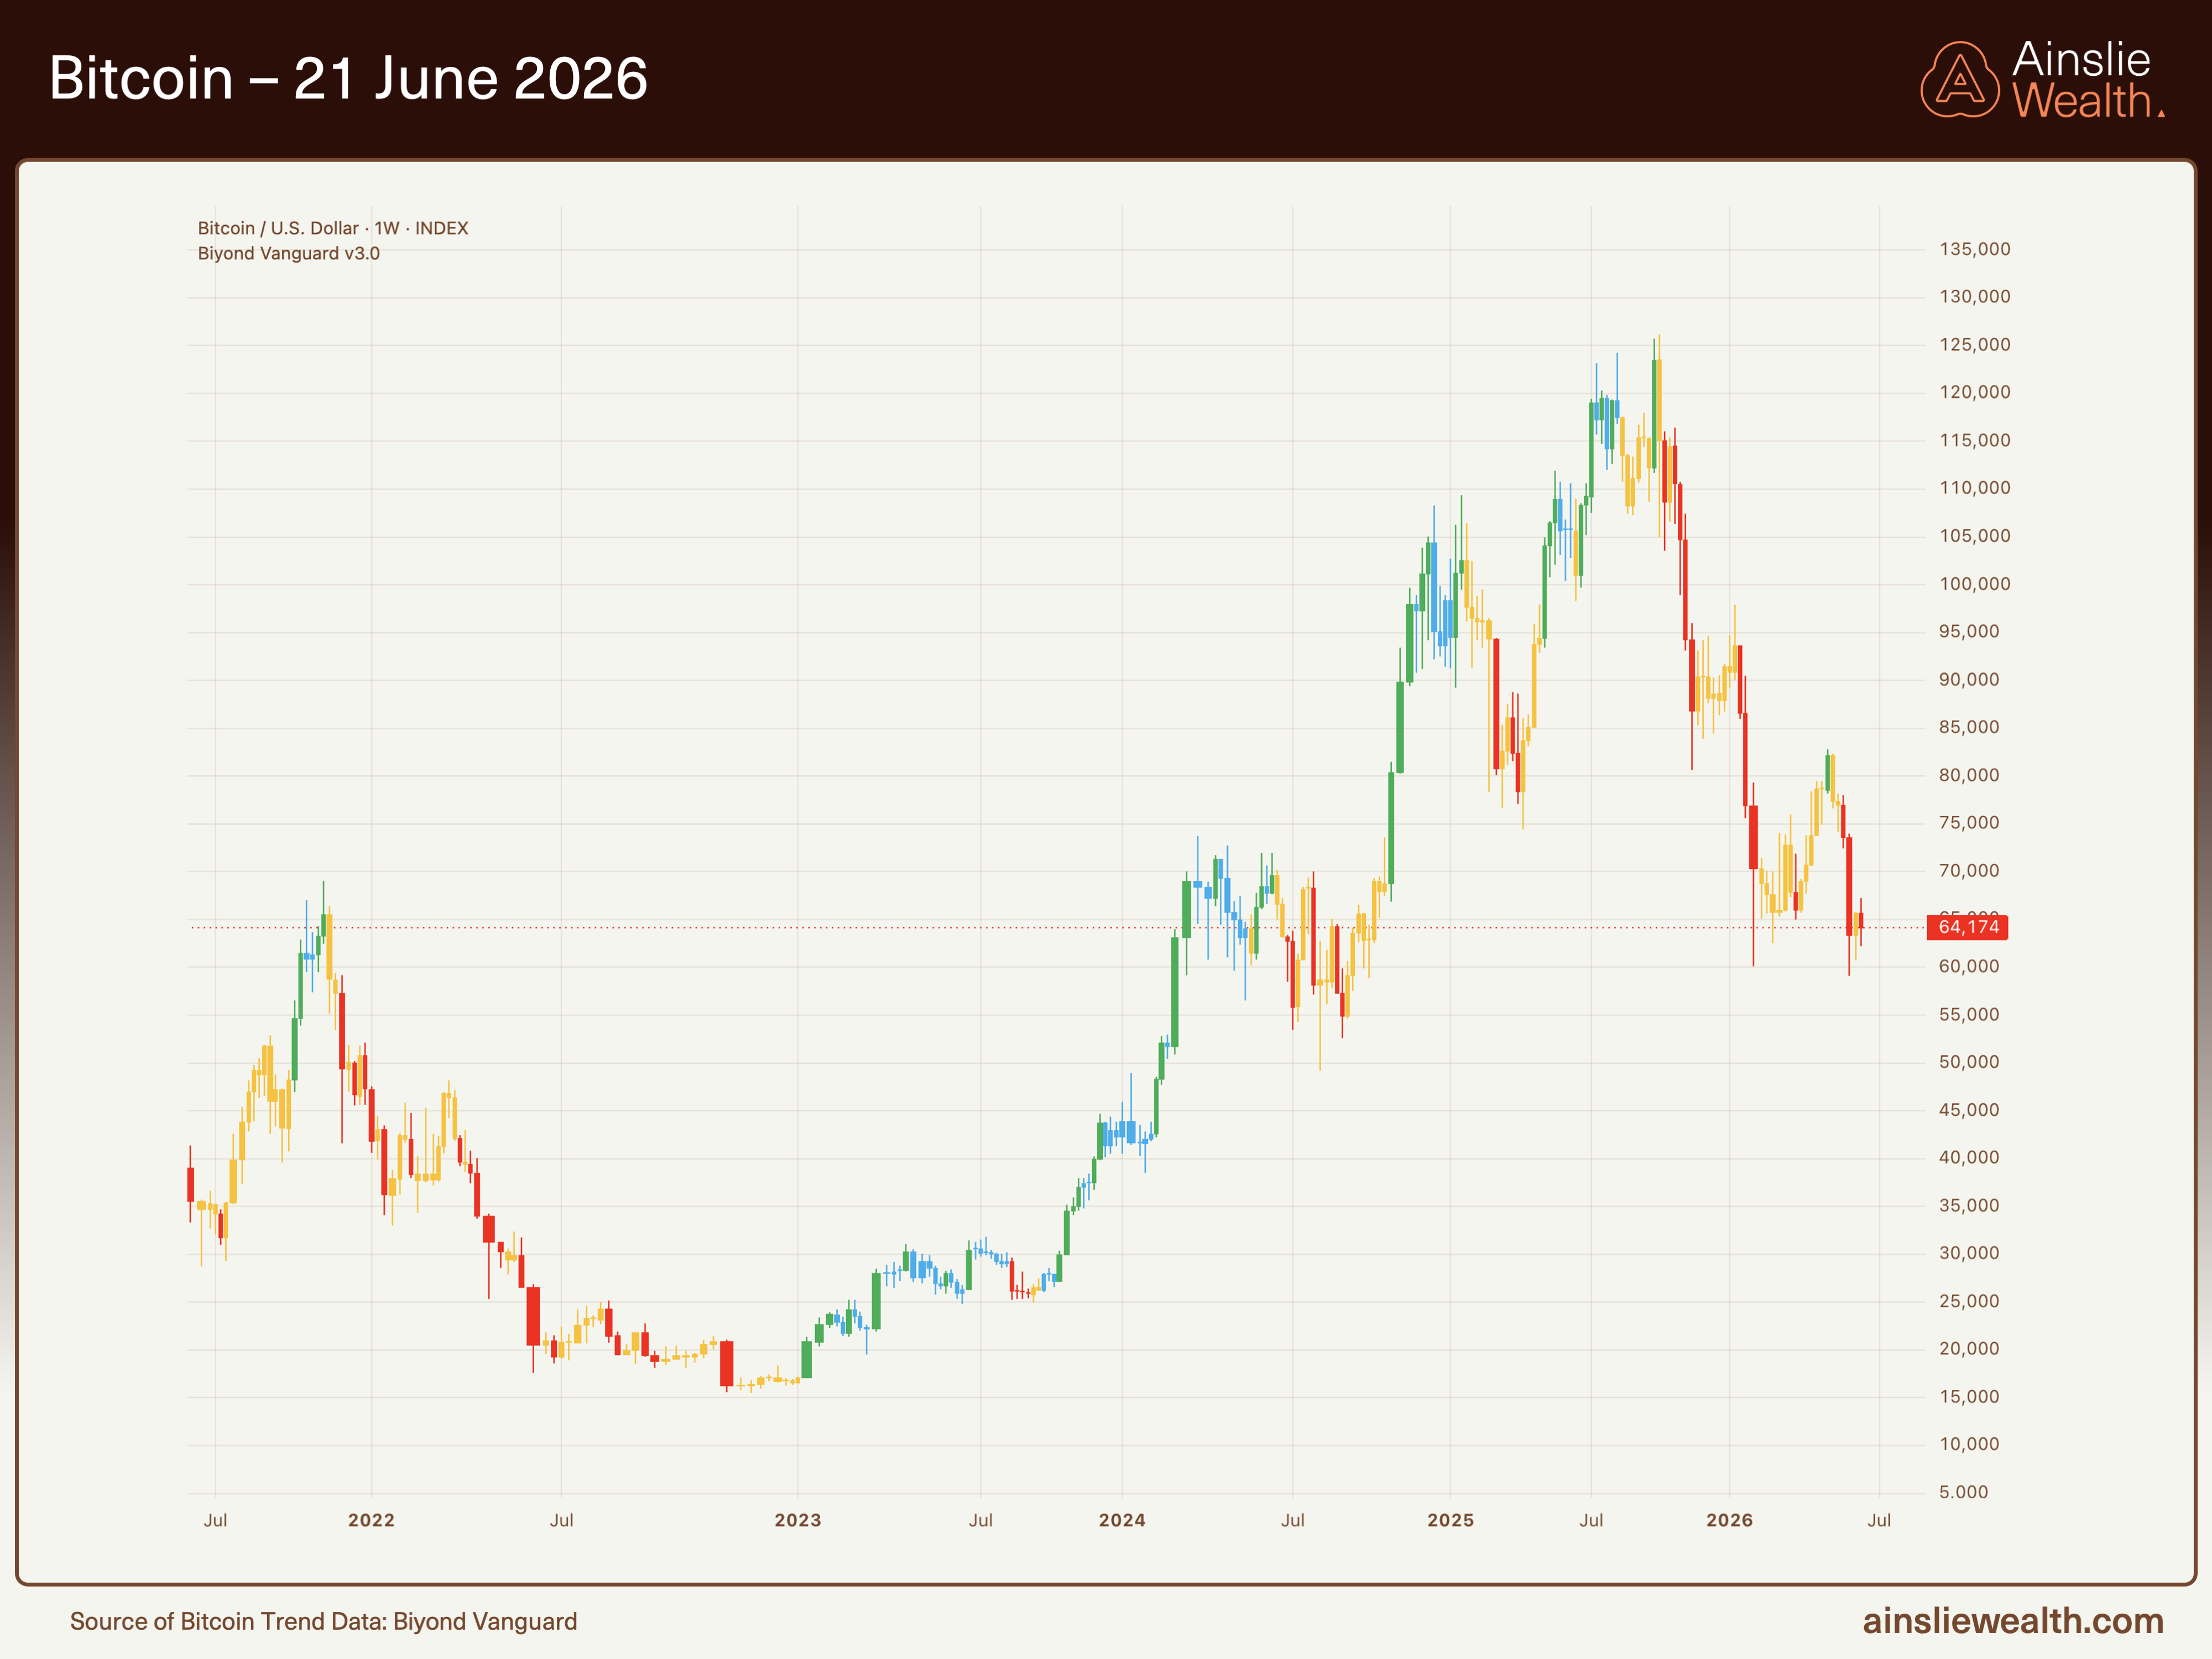
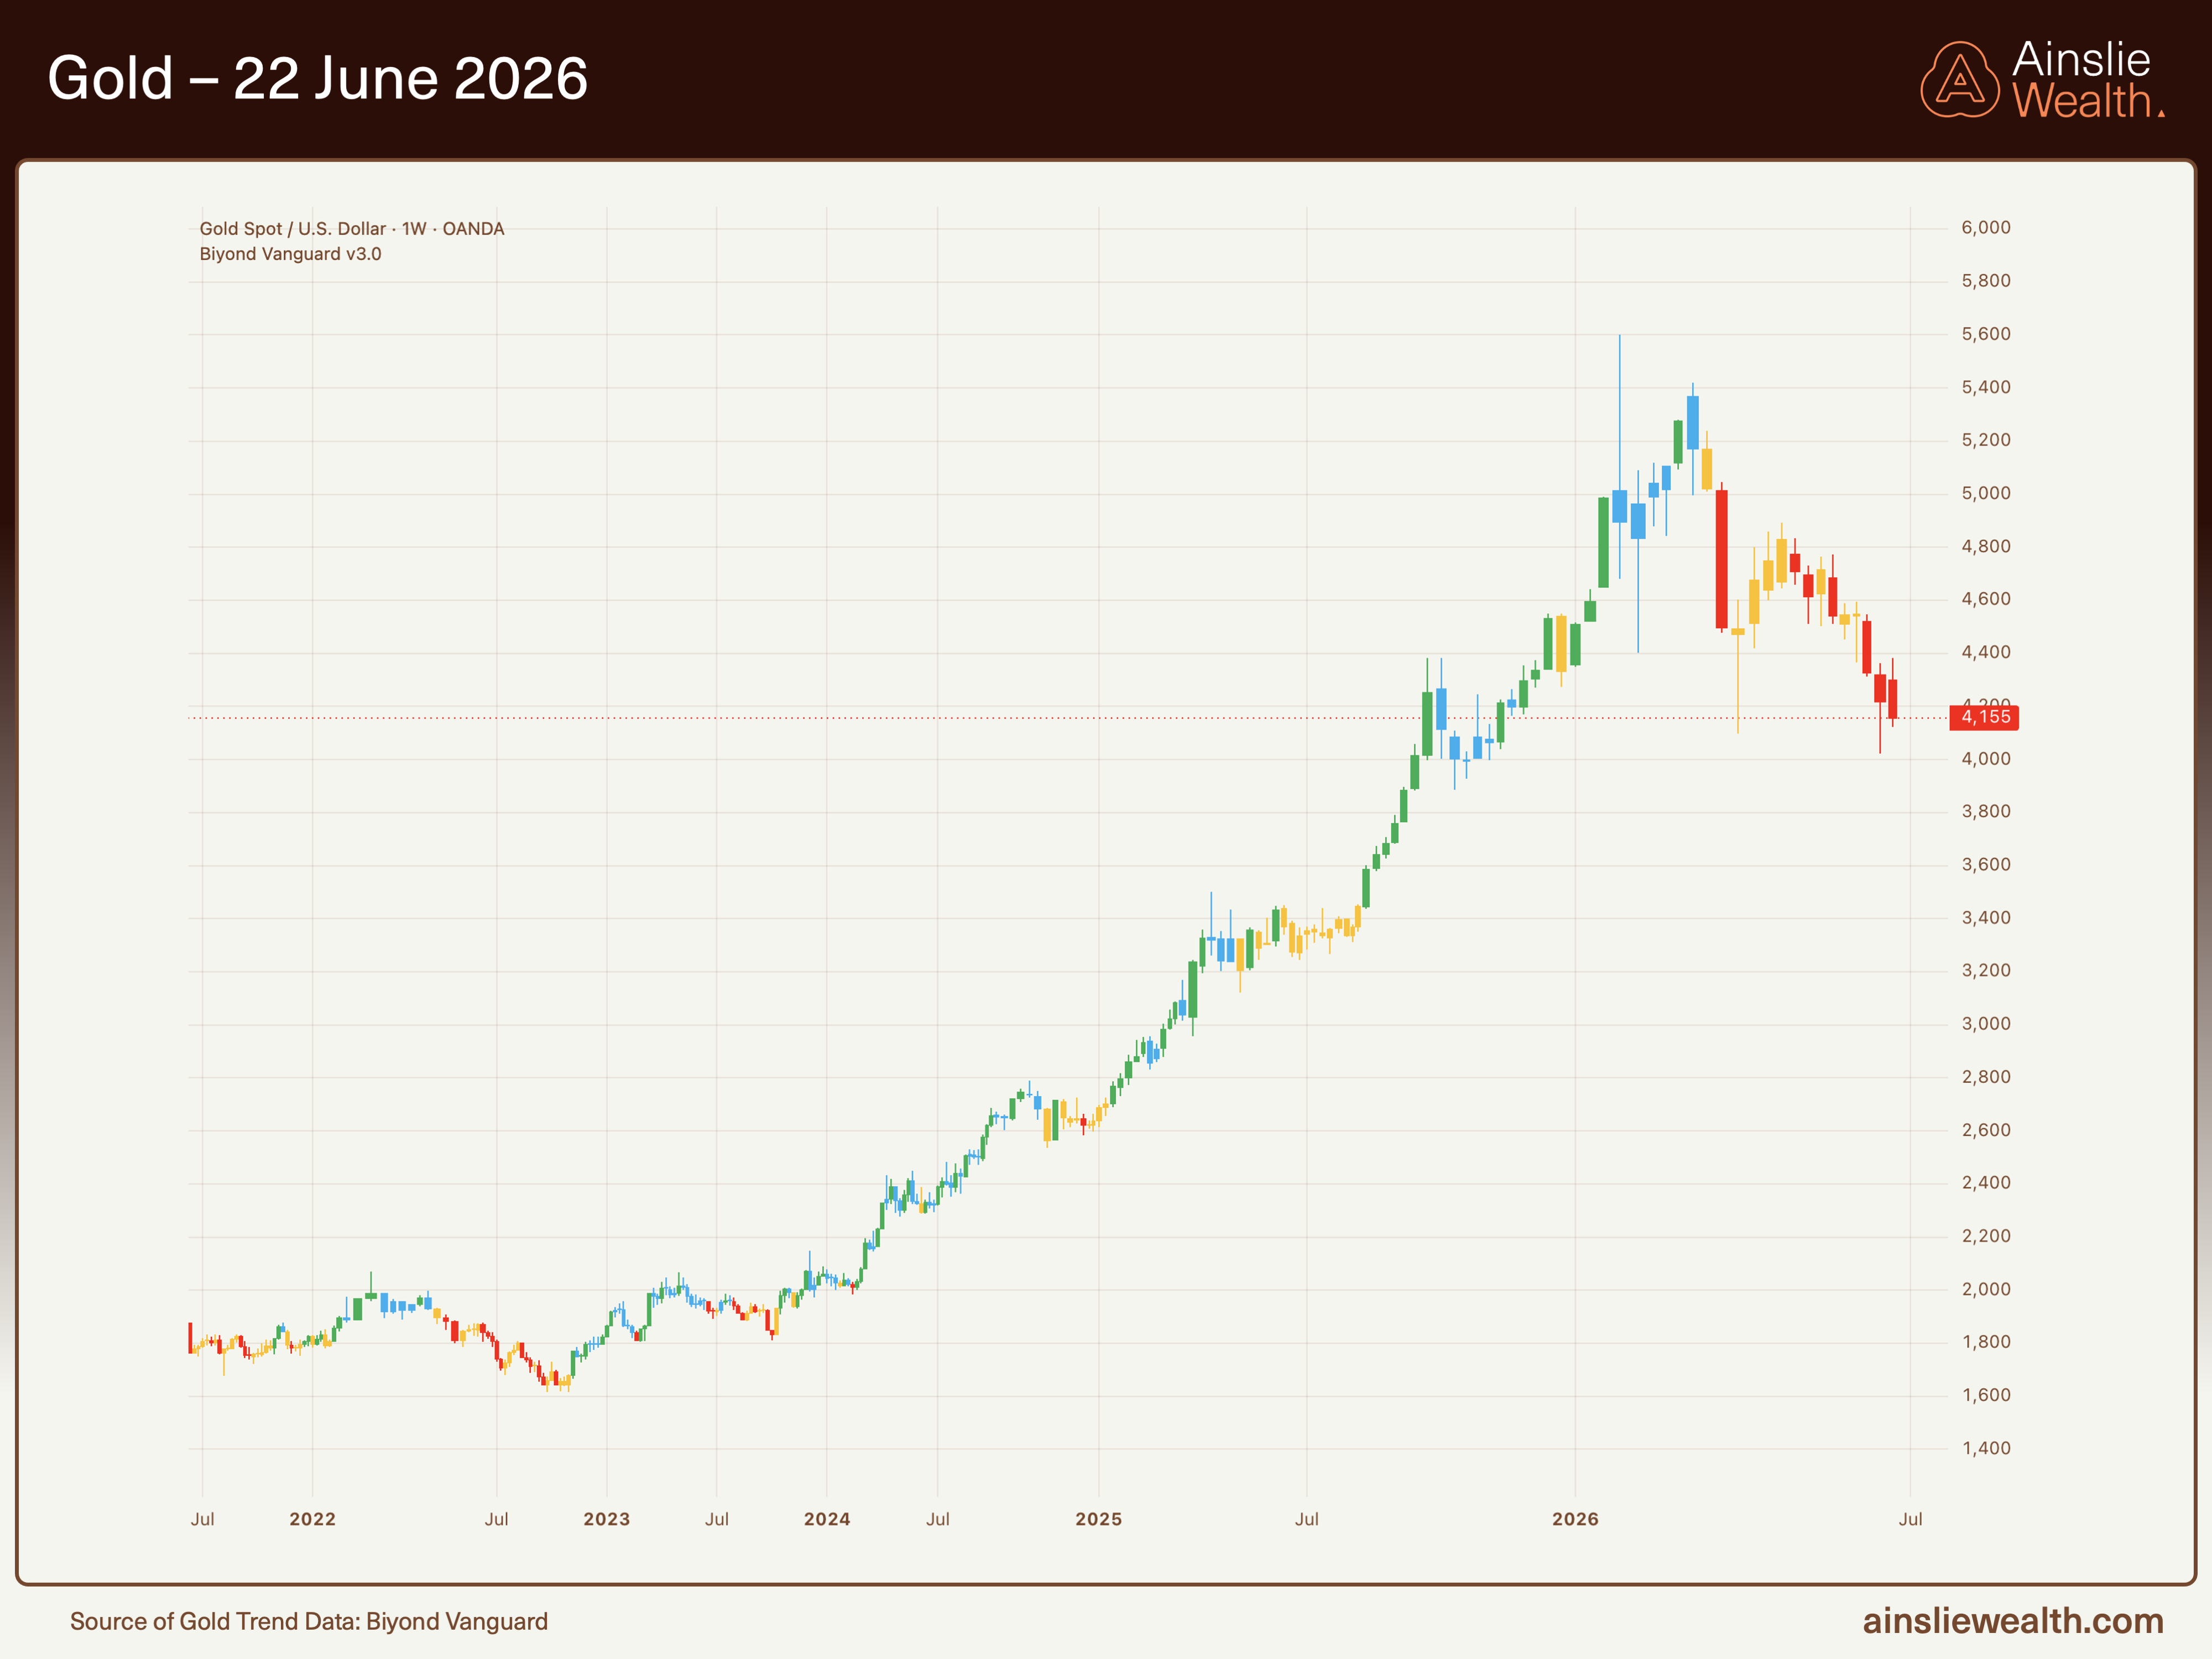
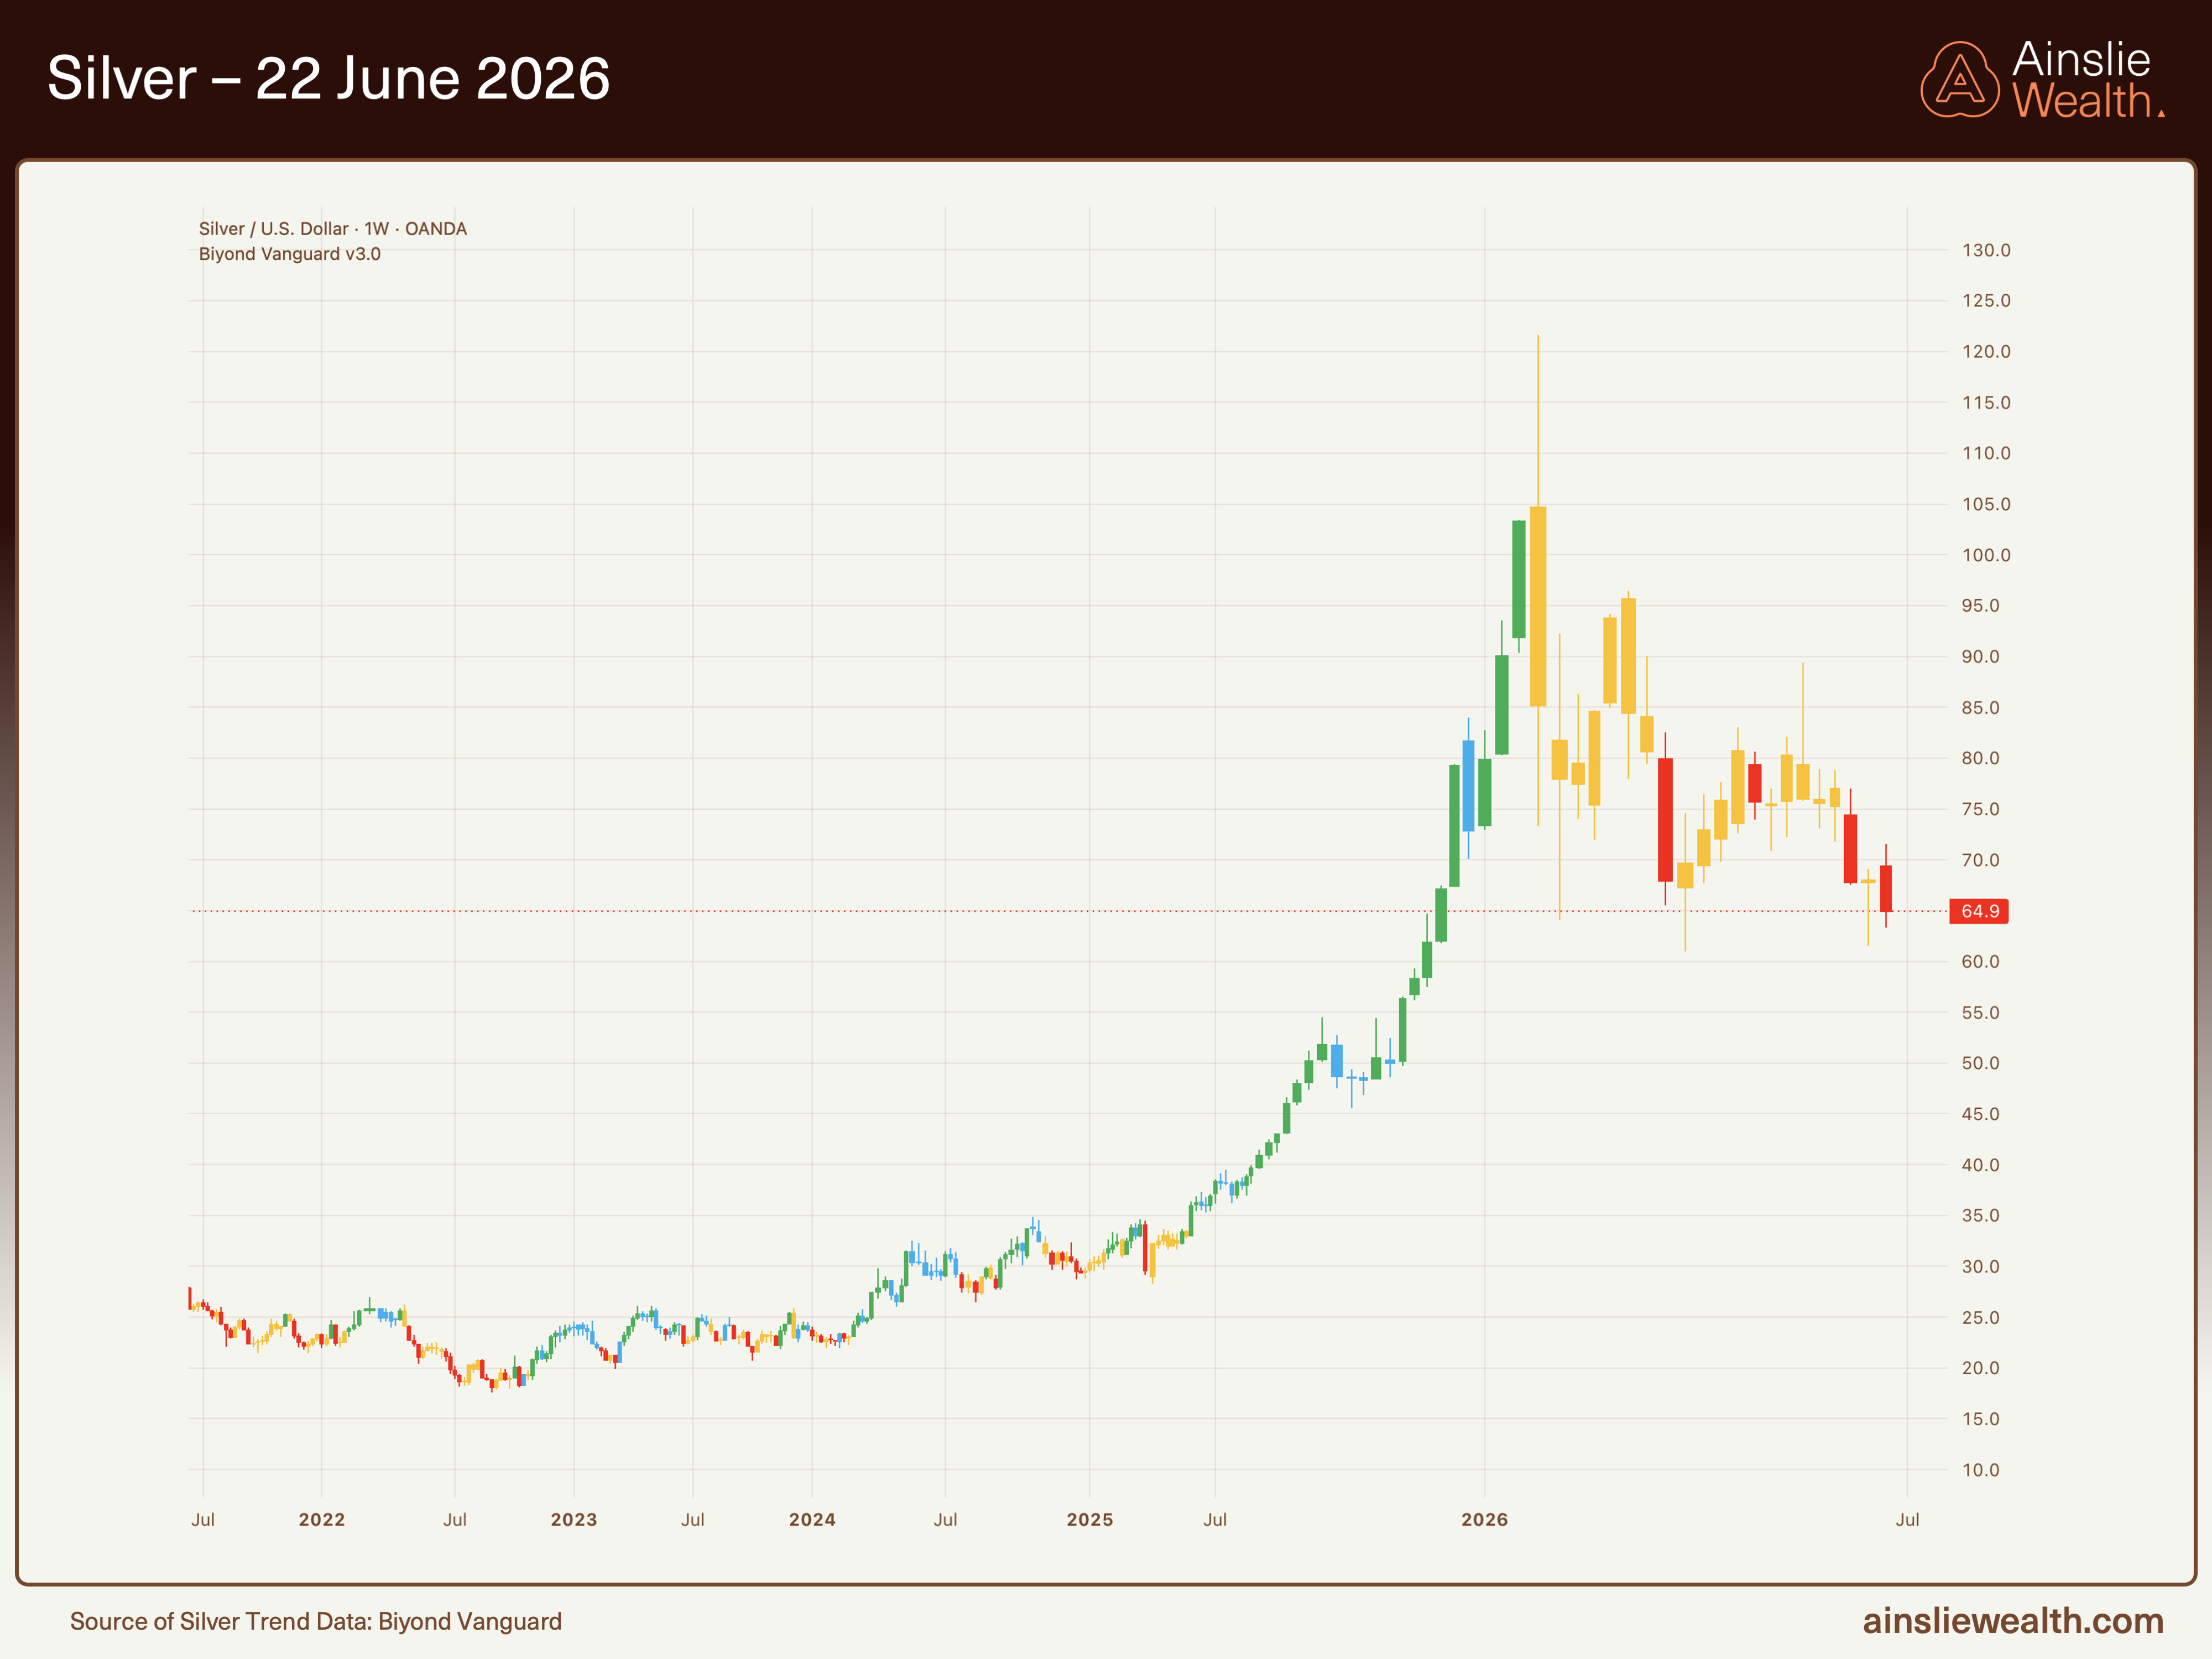
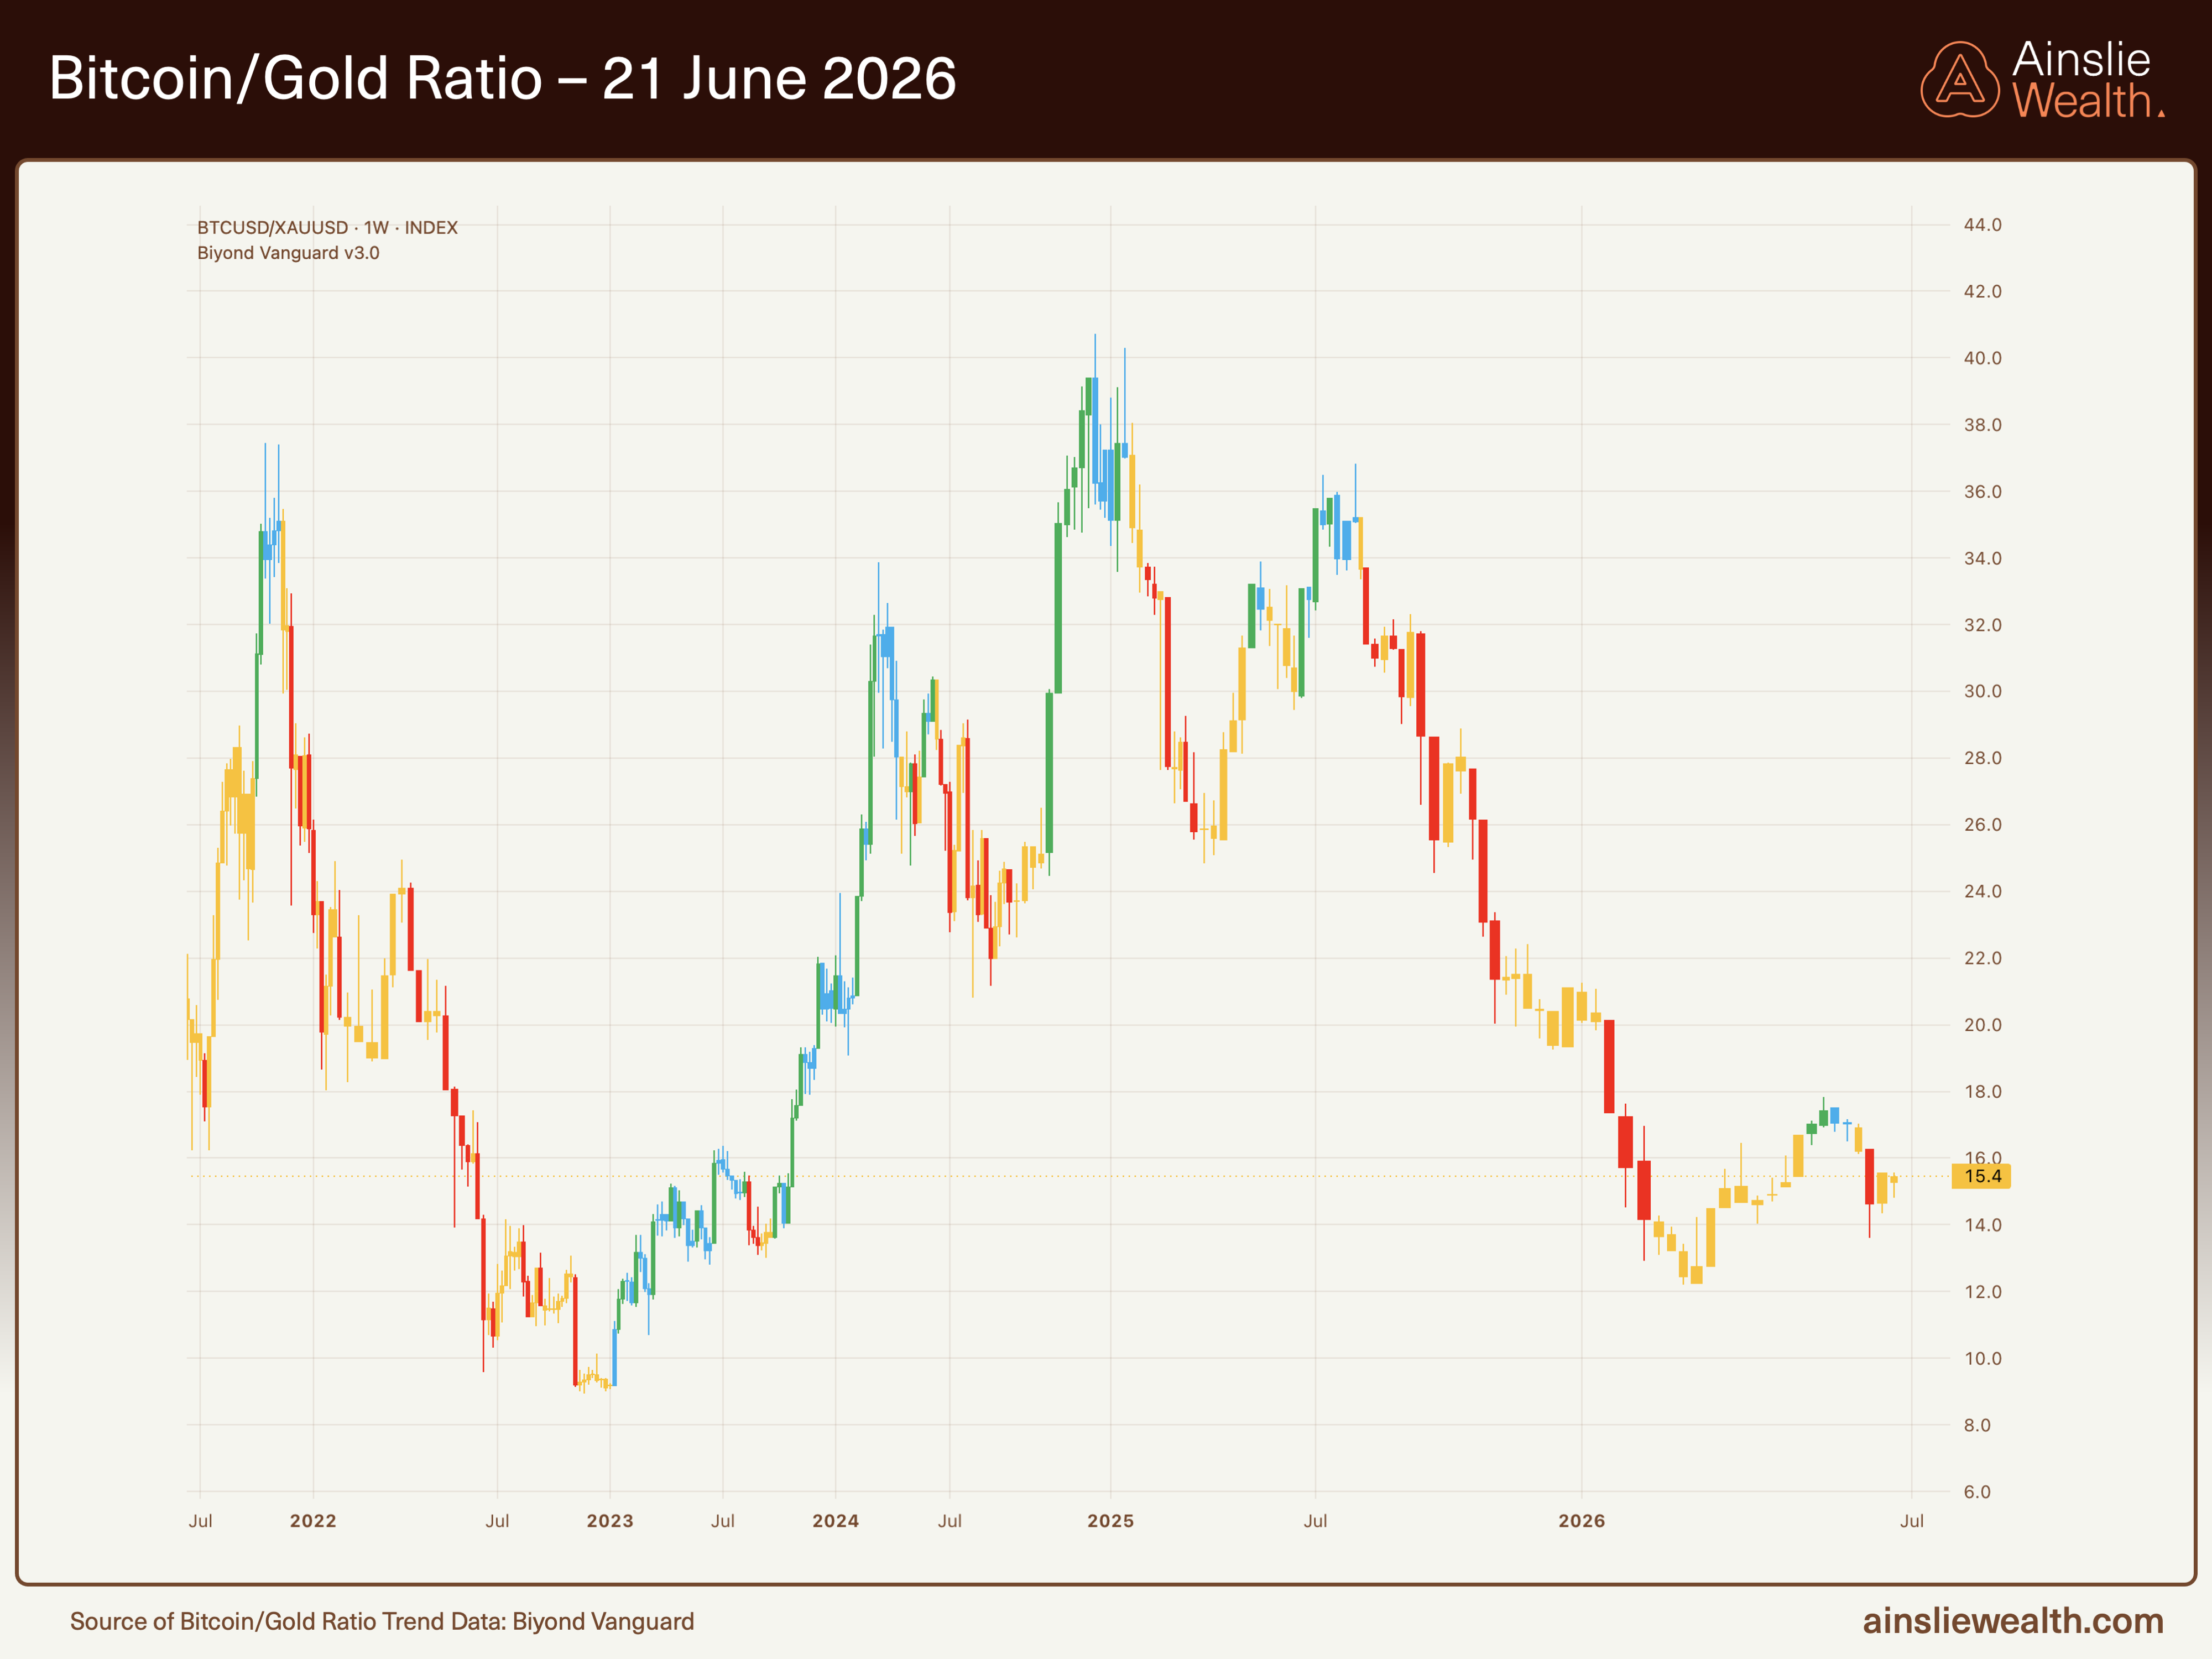
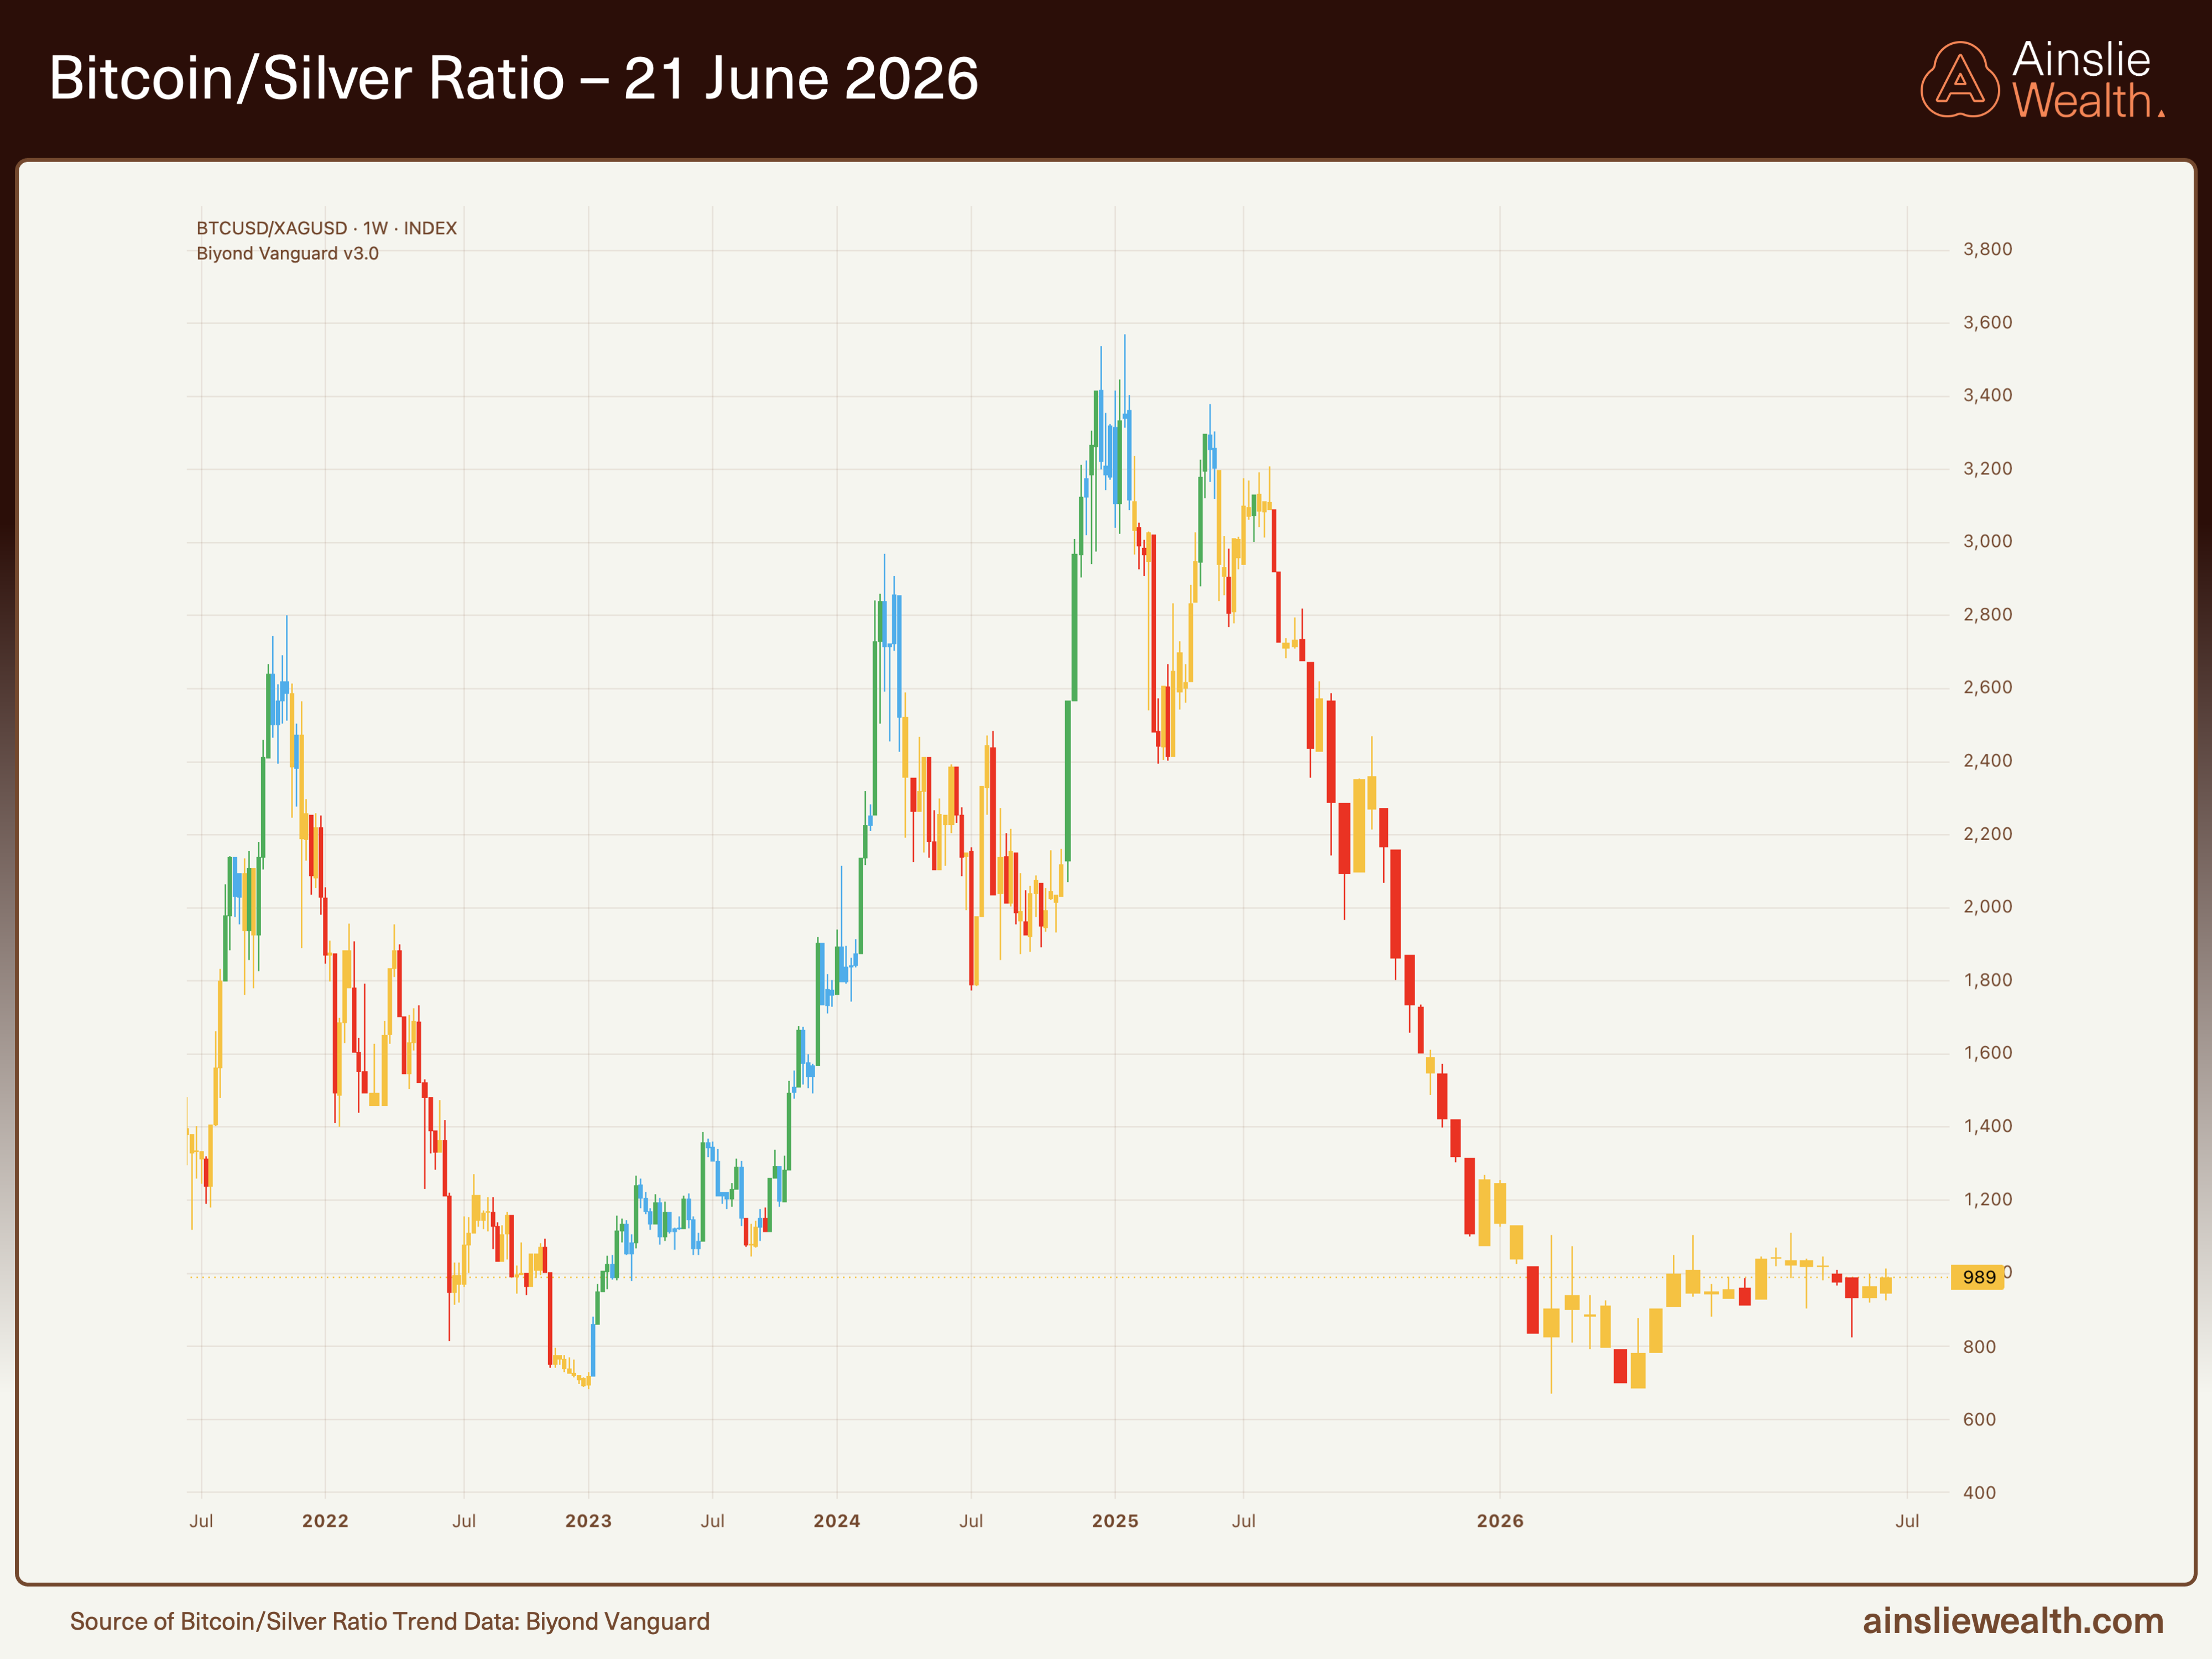
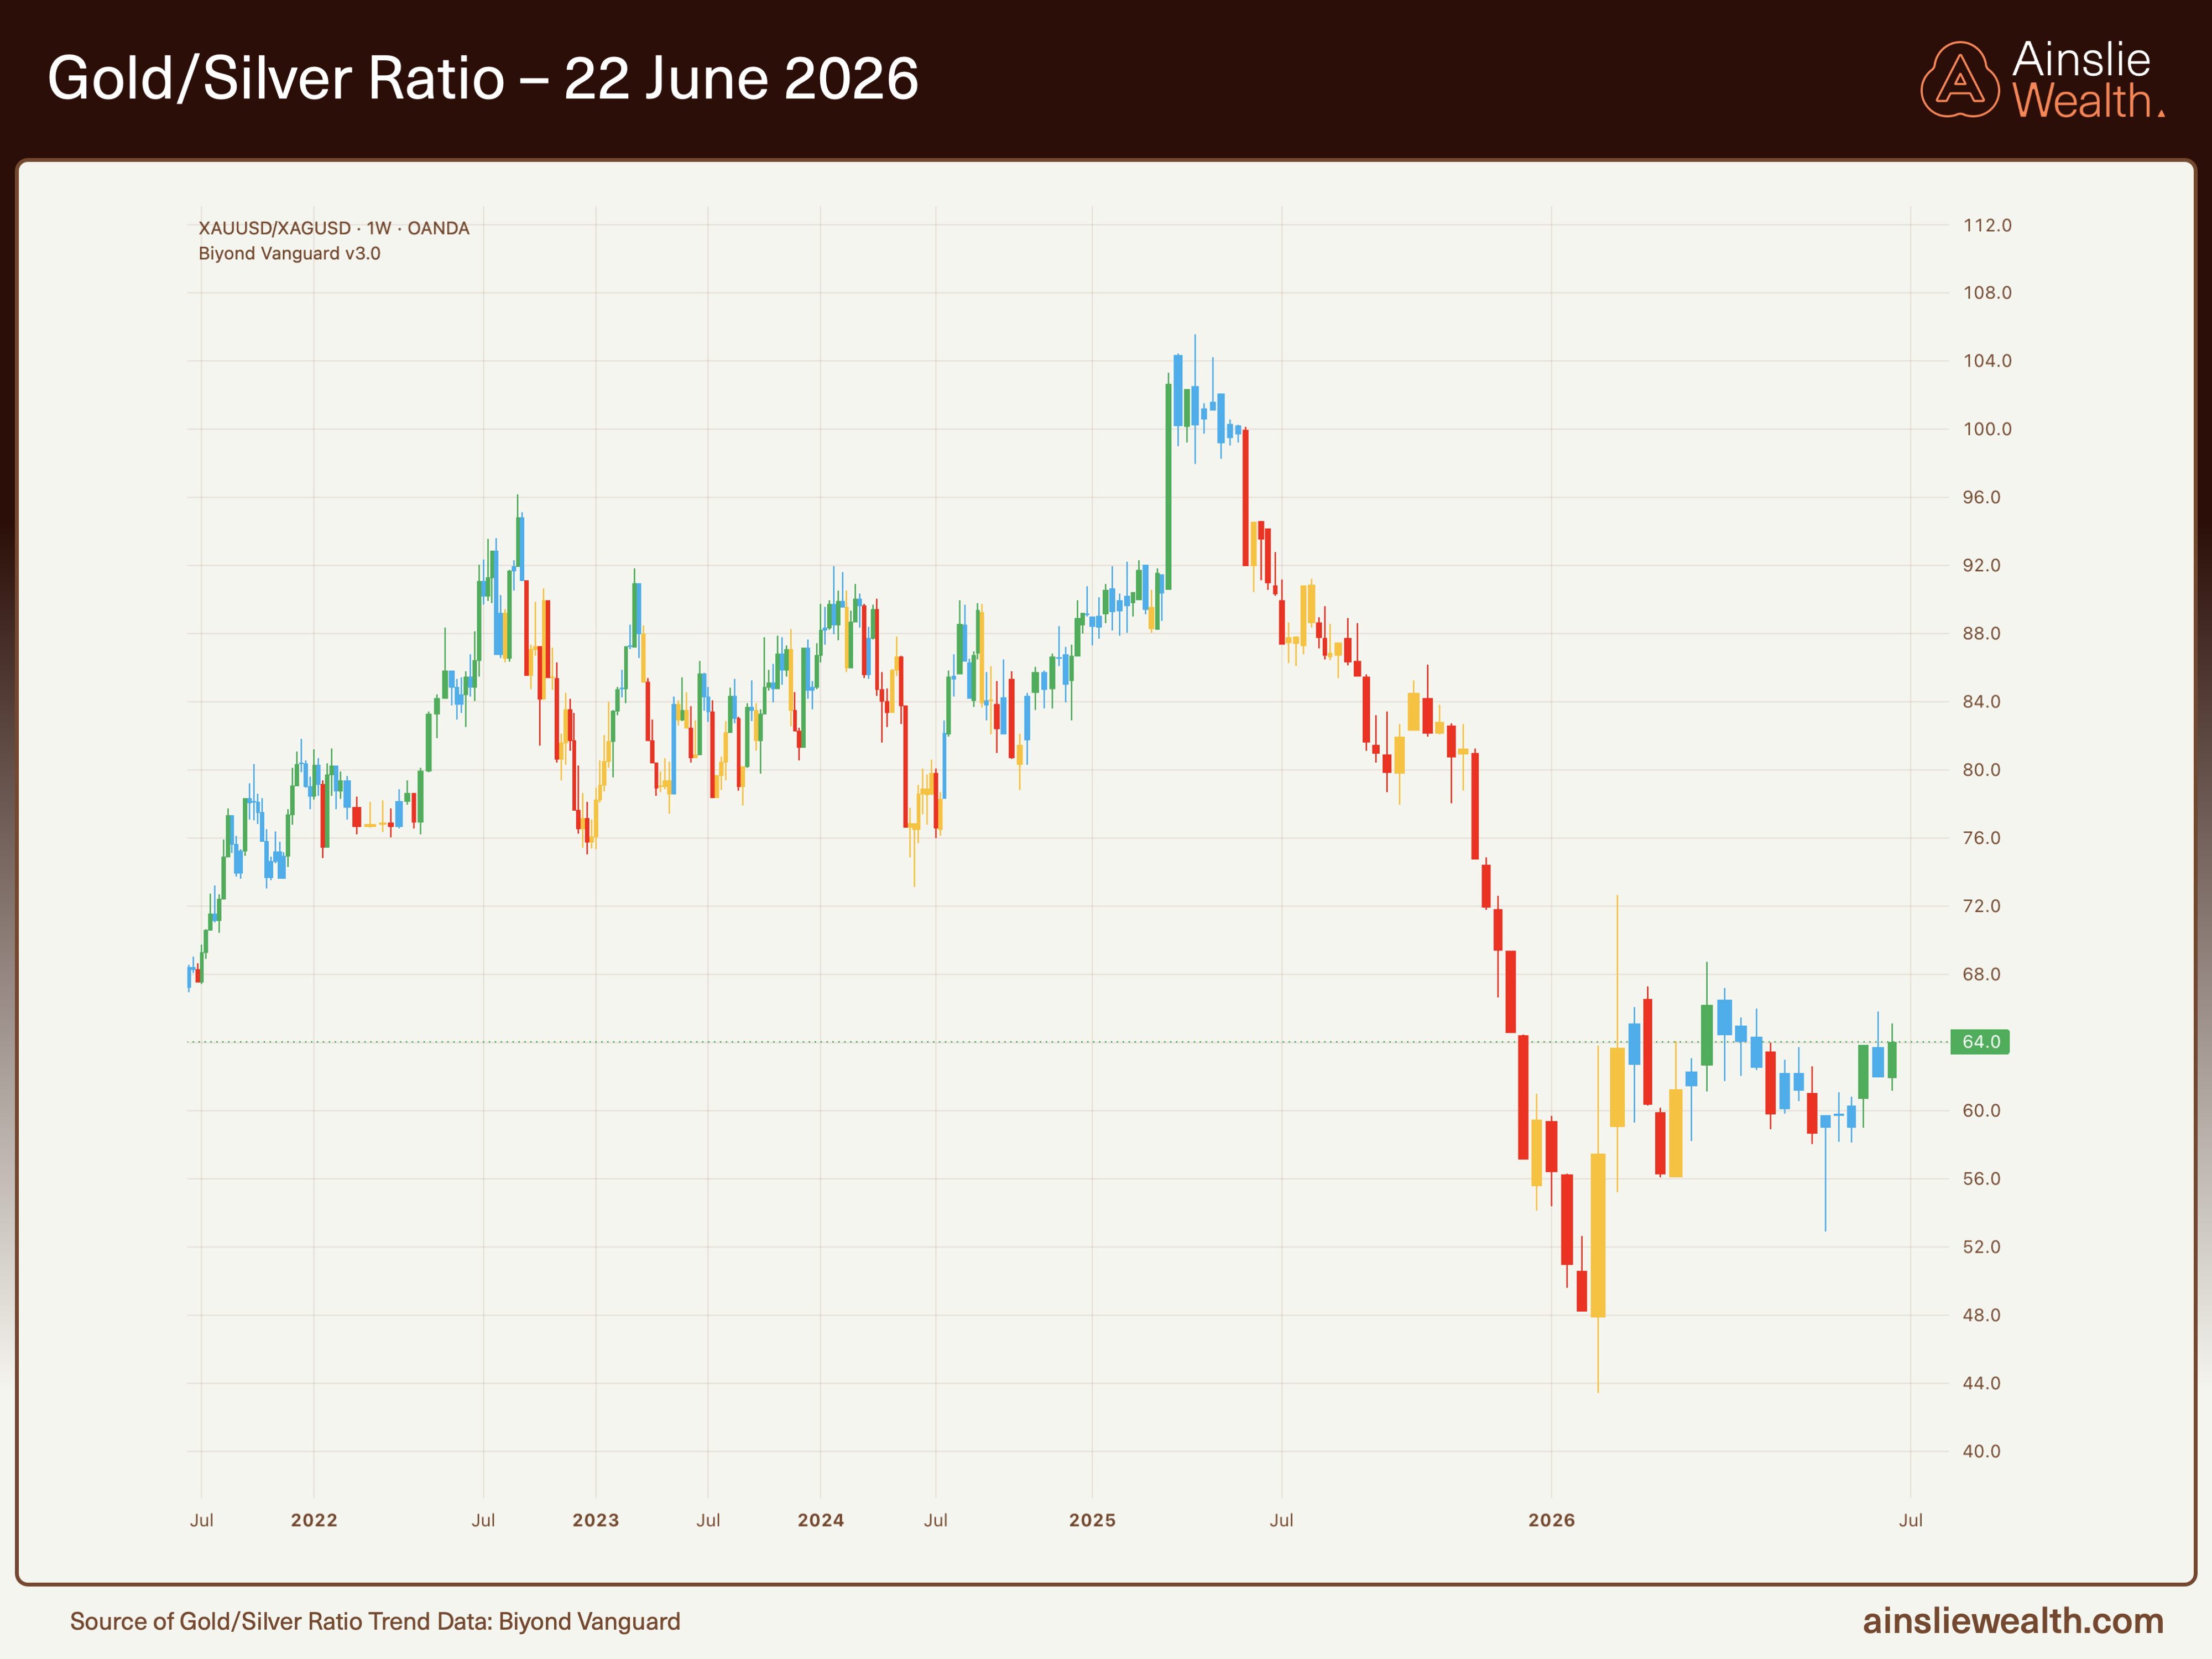
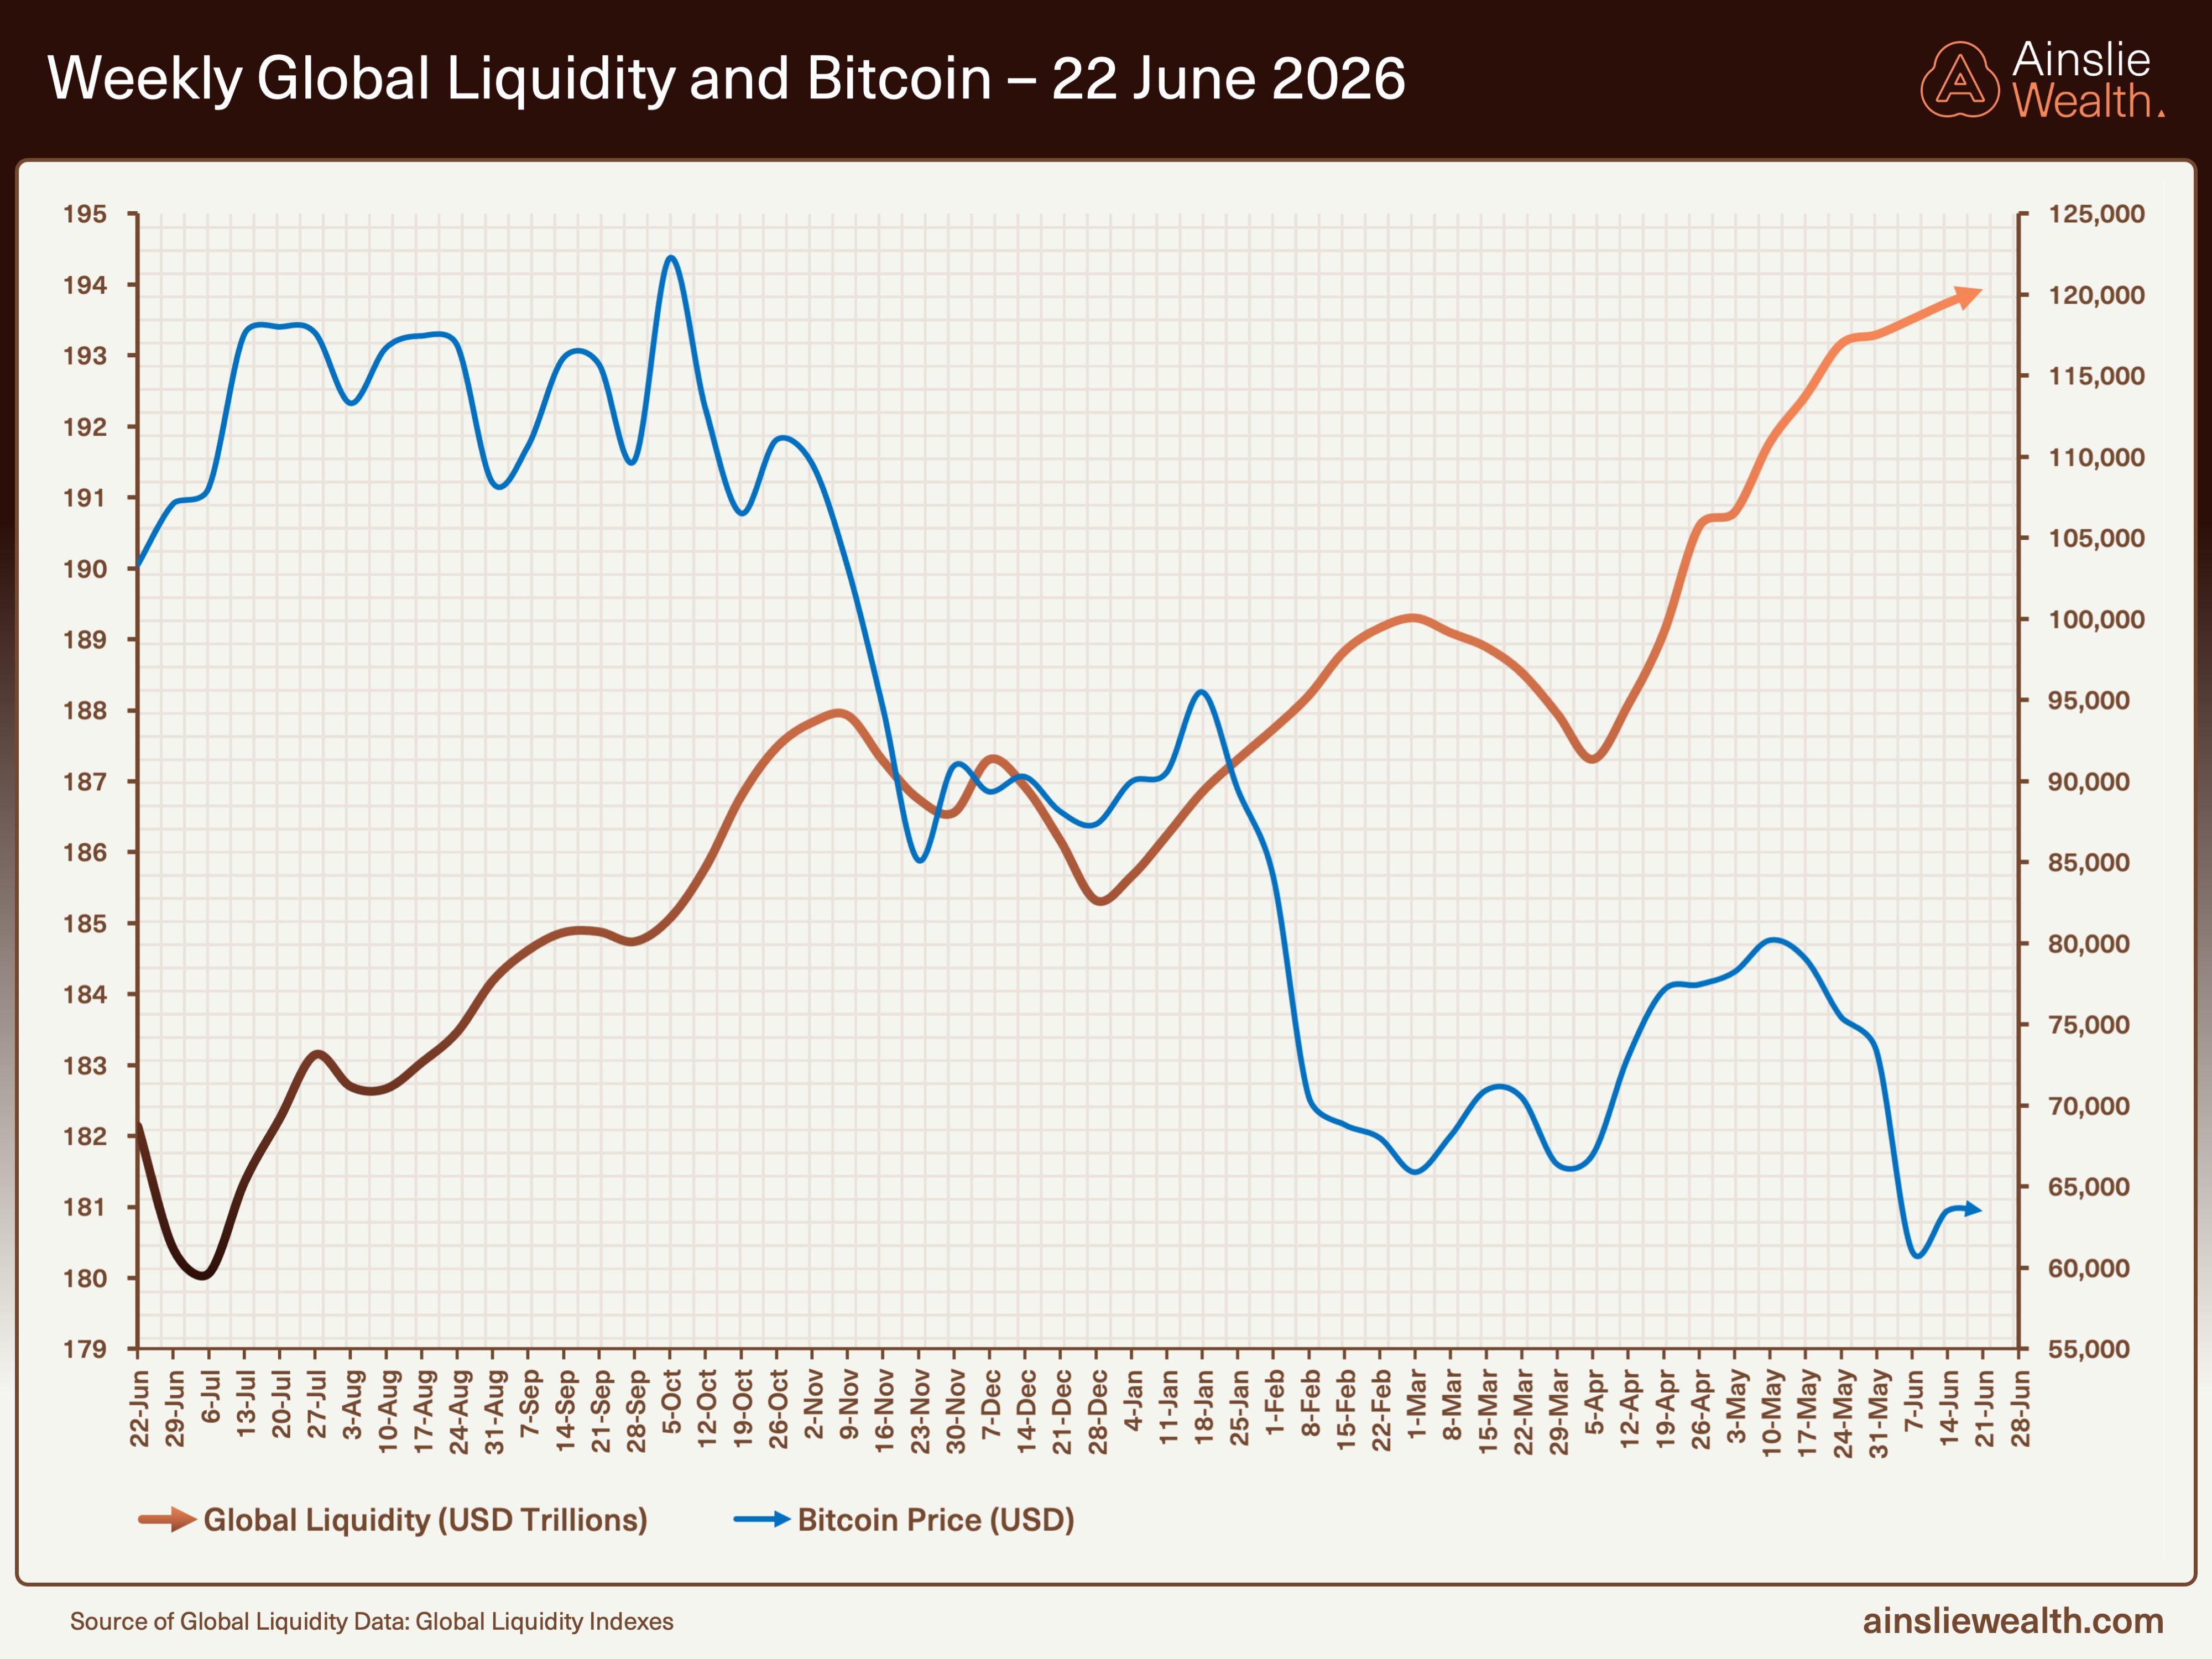
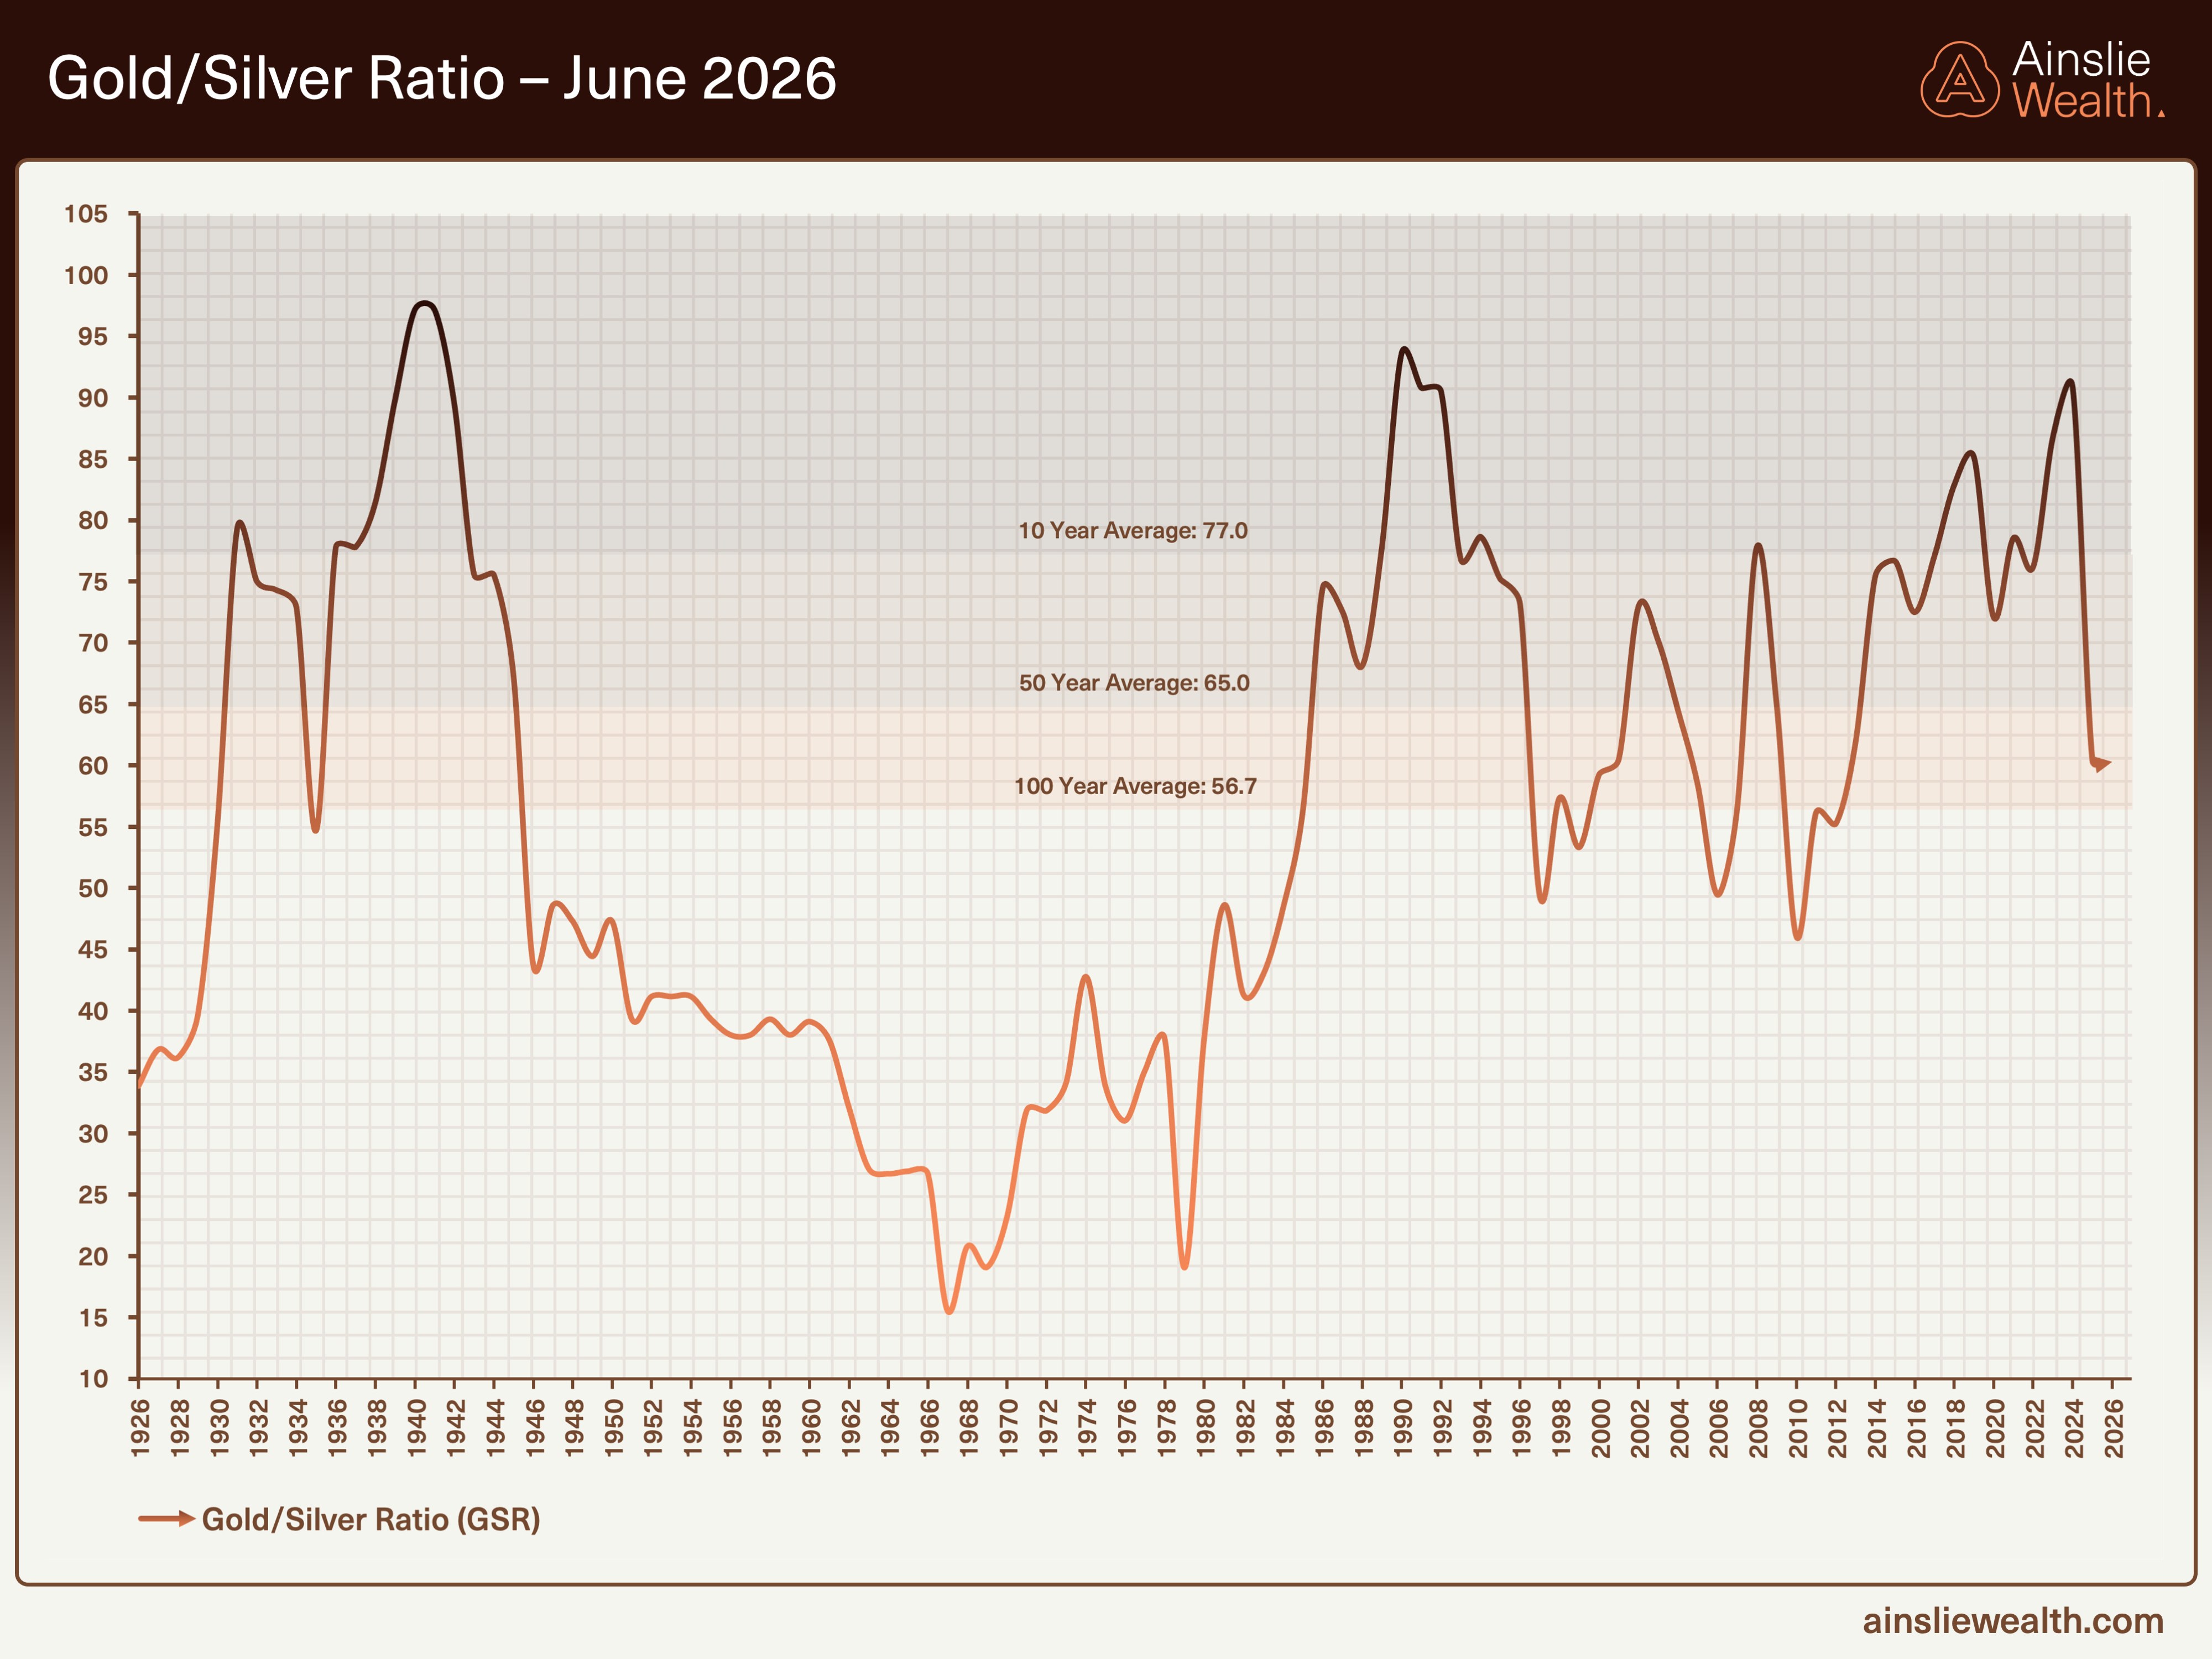
Bitcoin has recalibrated near key supports with bearish inclination on the momentum indicator while gold and silver continue to show weakness, yet maintain structural resilience. The paired reads show precious metals holding firm against Bitcoin’s relative lag. Ratios underscore commodities continuing to outperform financial assets in this environment, with the gold/silver ratio highlighting the hybrid role silver plays between monetary and industrial drivers. The dashboard picture remains one of a floor that is holding without delivering new reflexive impulse.
Liquidity Conditions
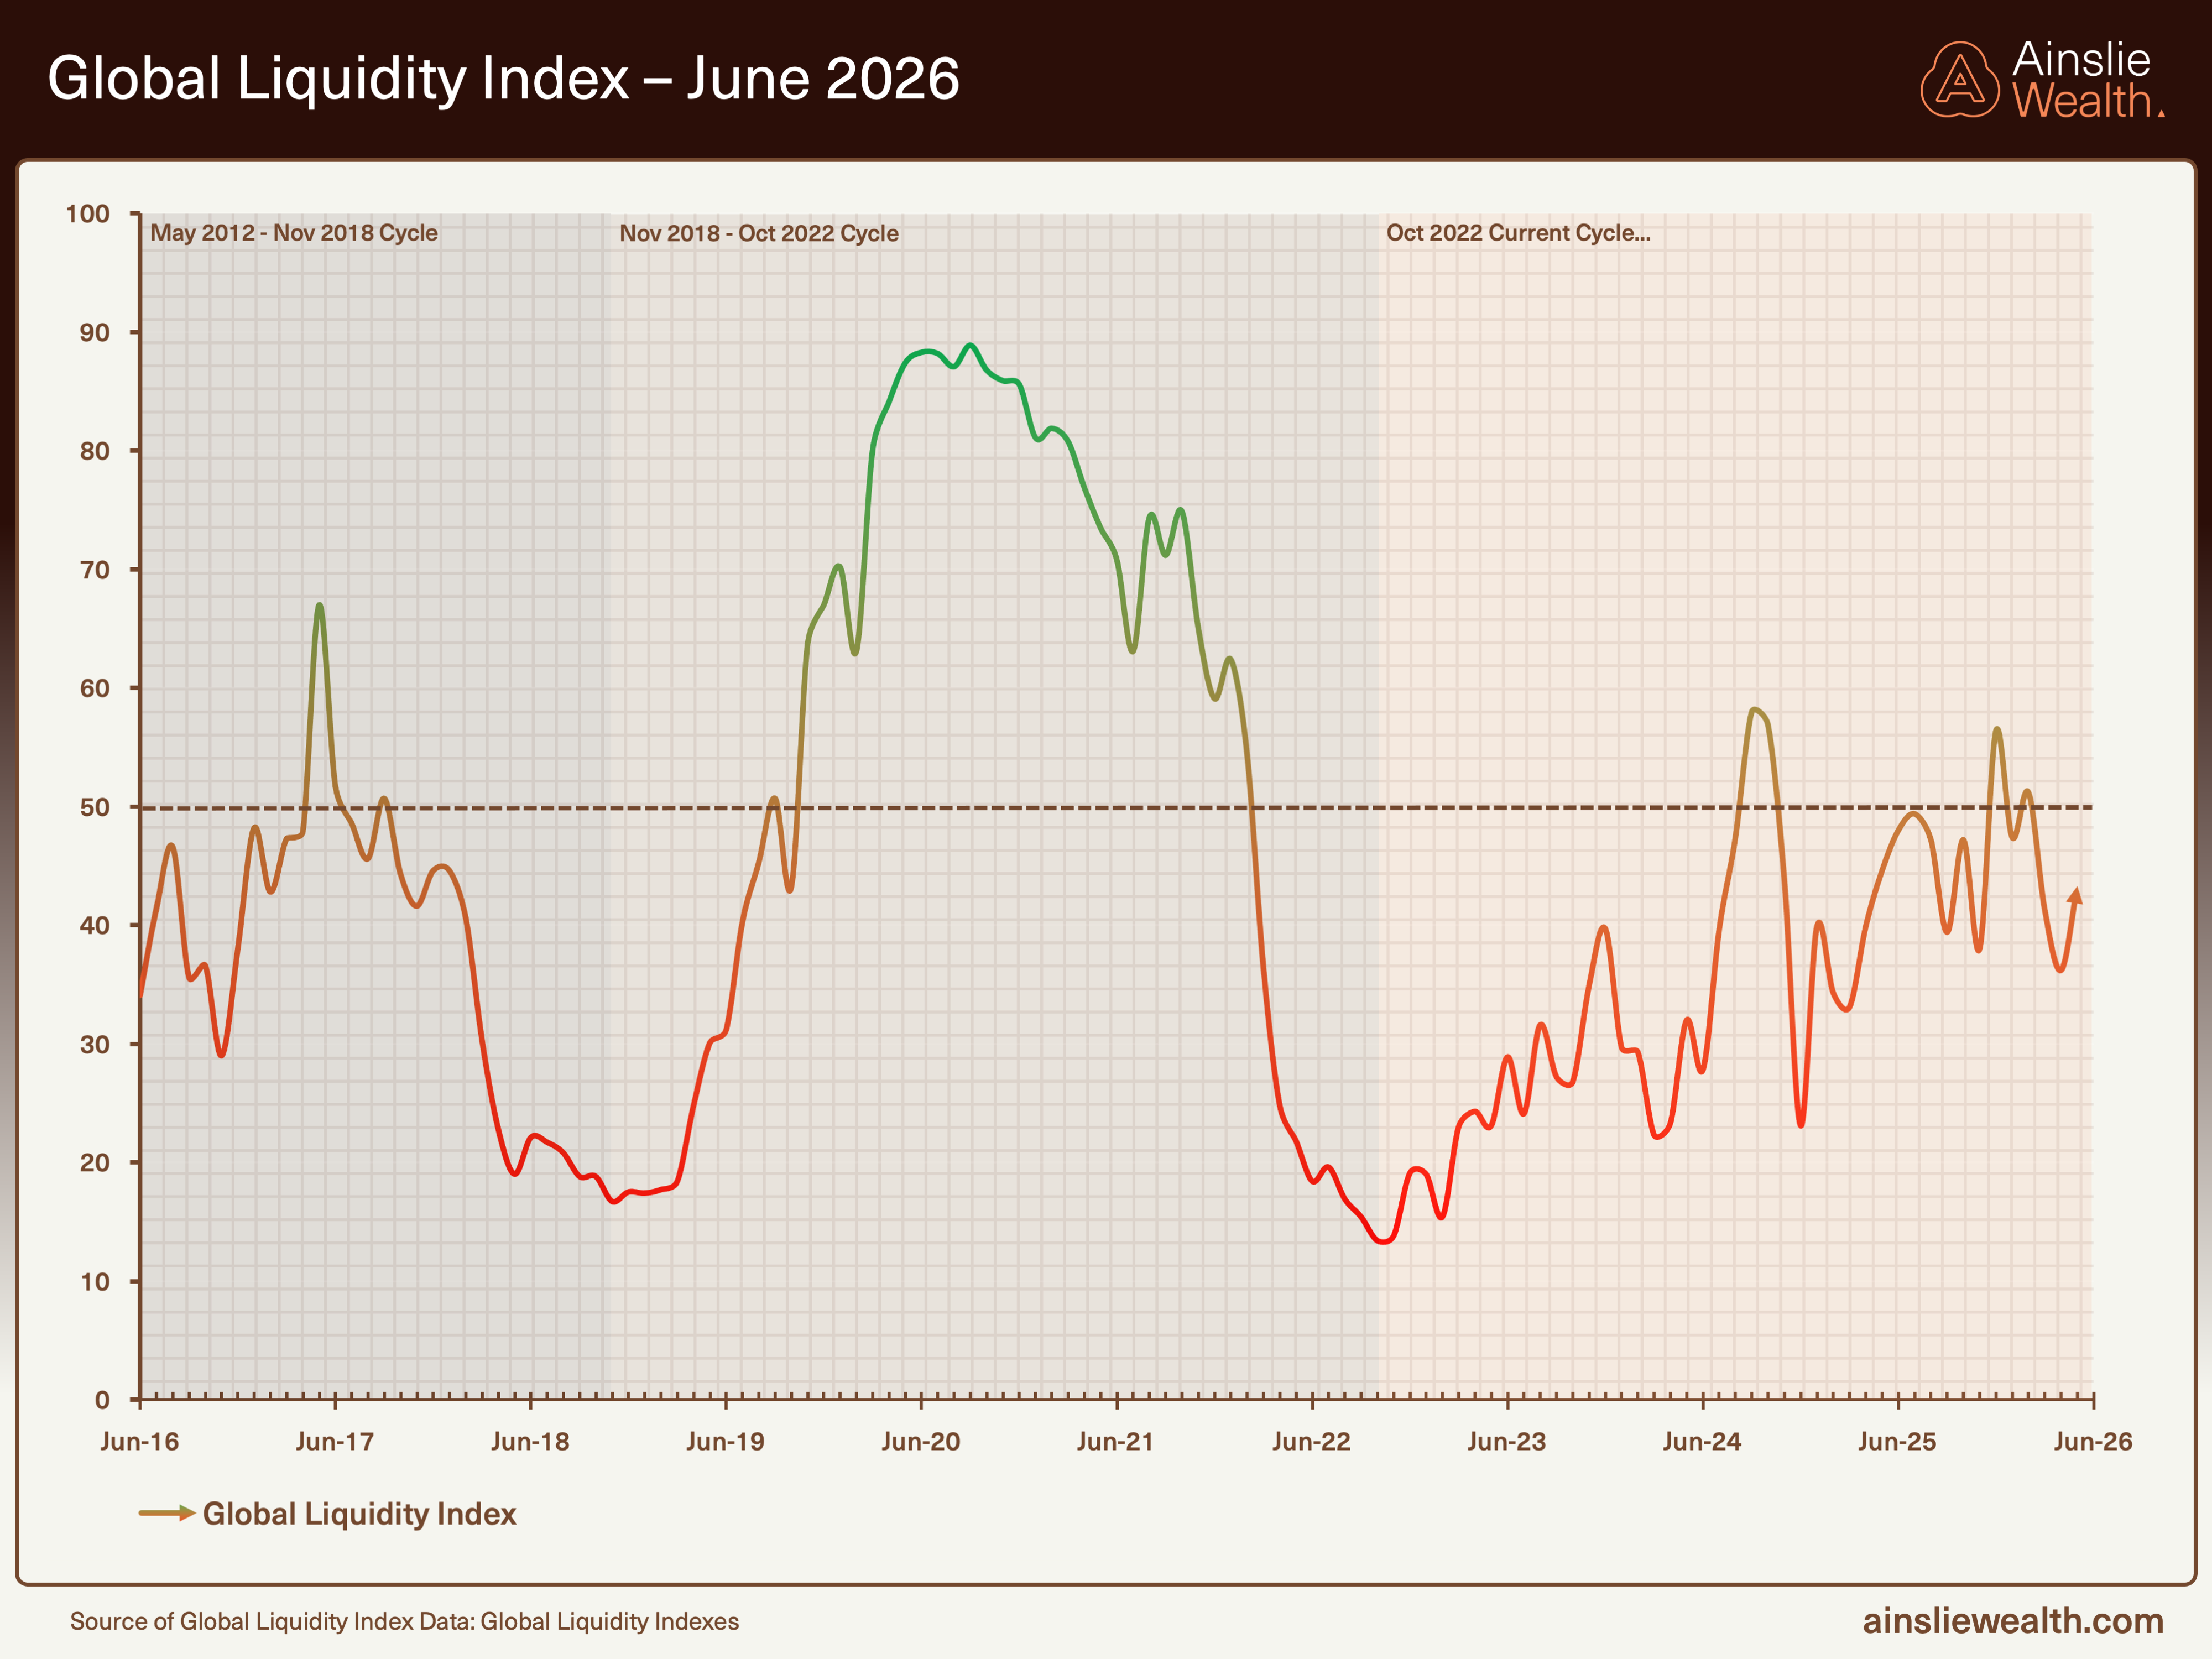
The core argument: the nominal liquidity pool is being actively held at fresh records by plumbing measures and renewed Eastern injections, yet the underlying cycle momentum continues to deteriorate as capital is absorbed into a stronger real economy.
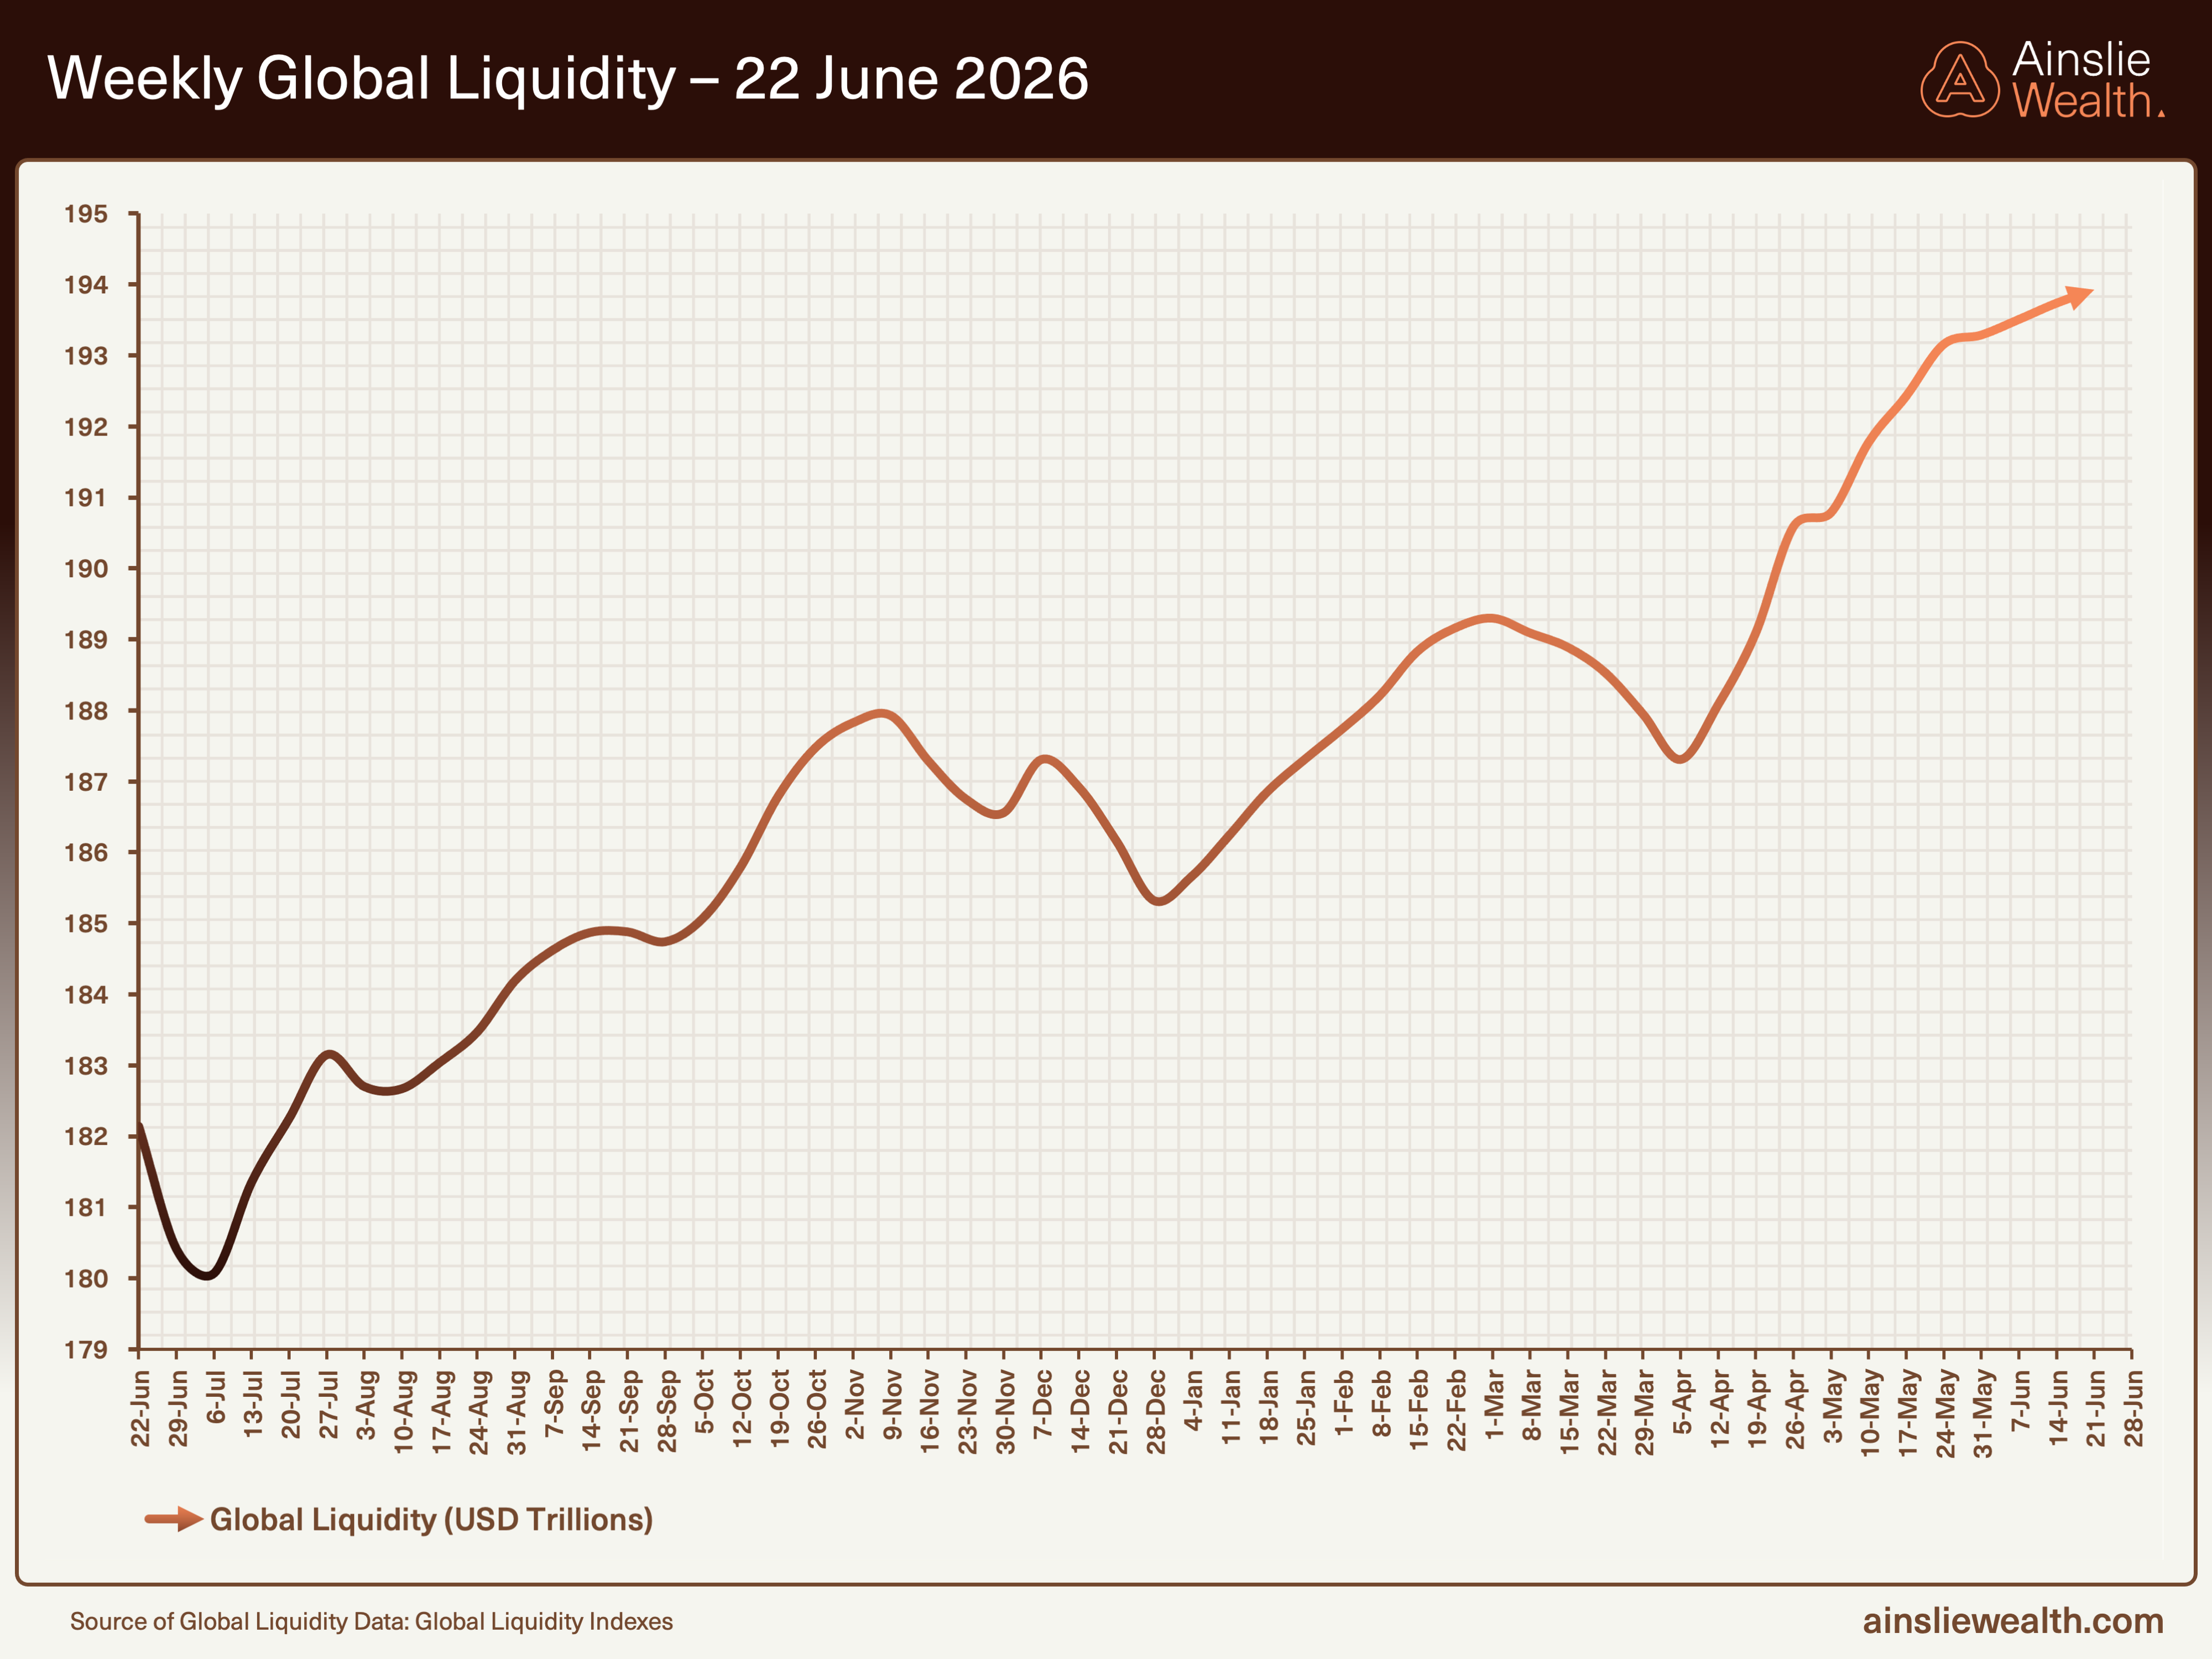
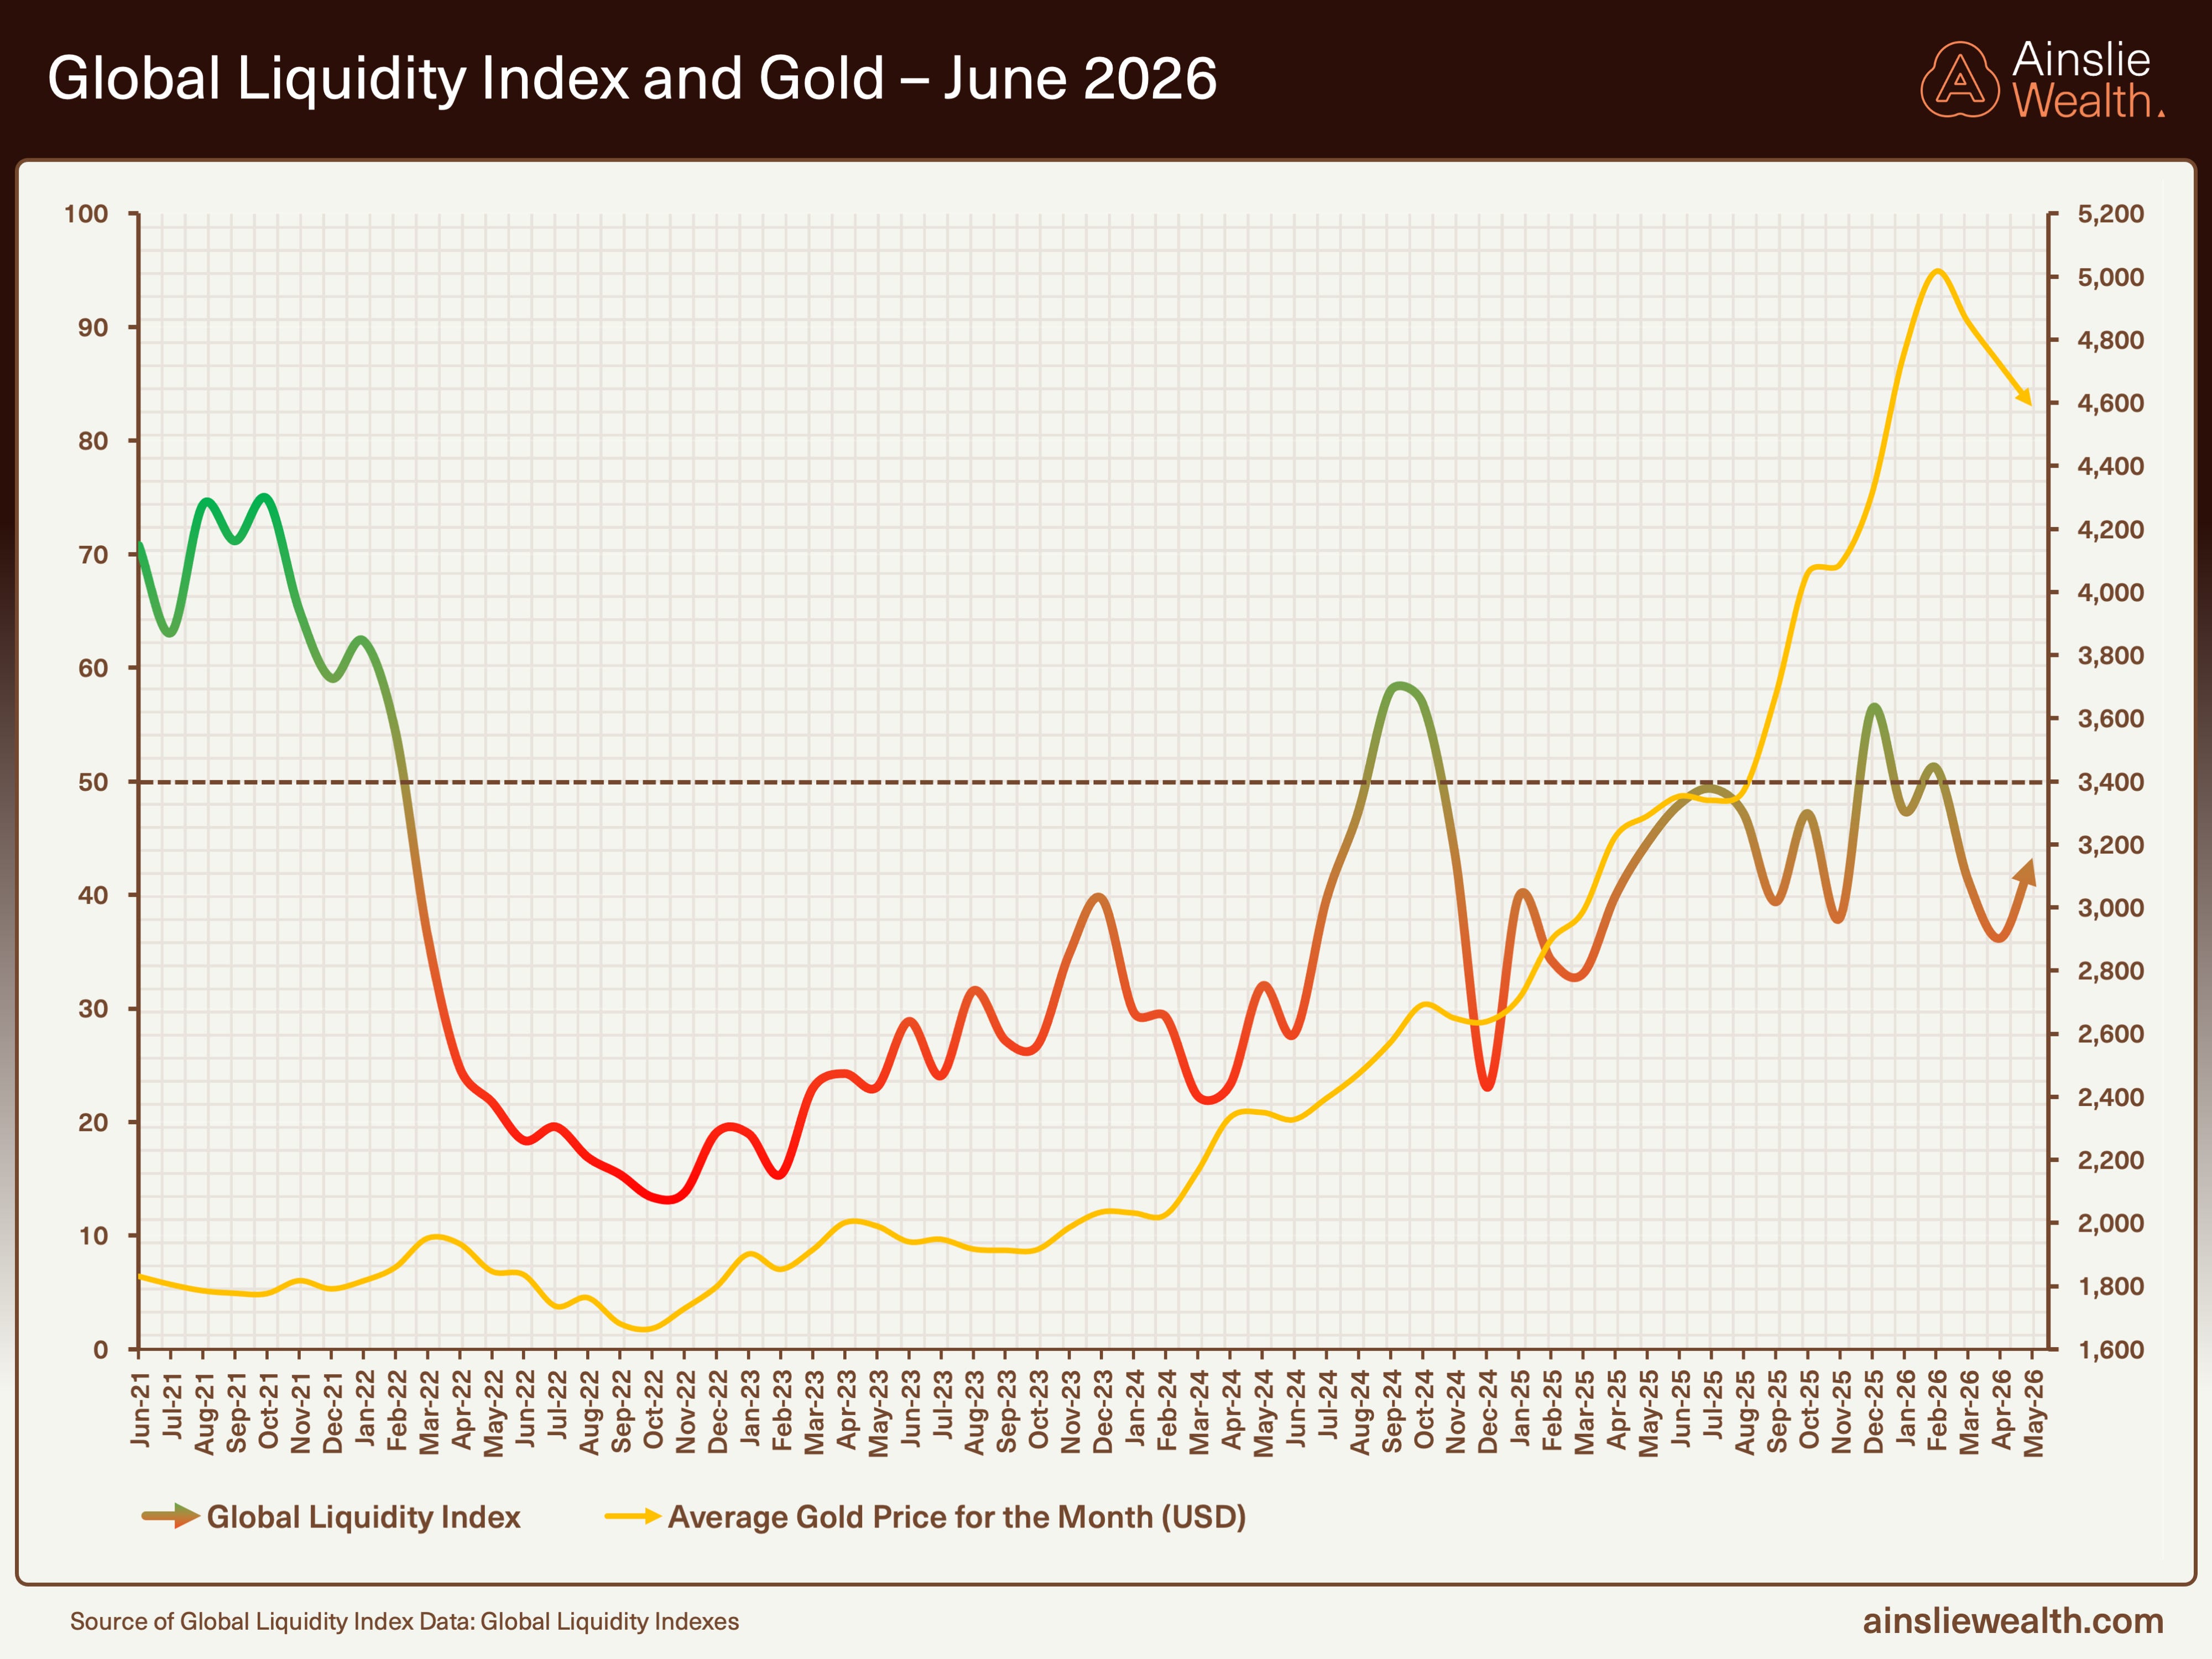
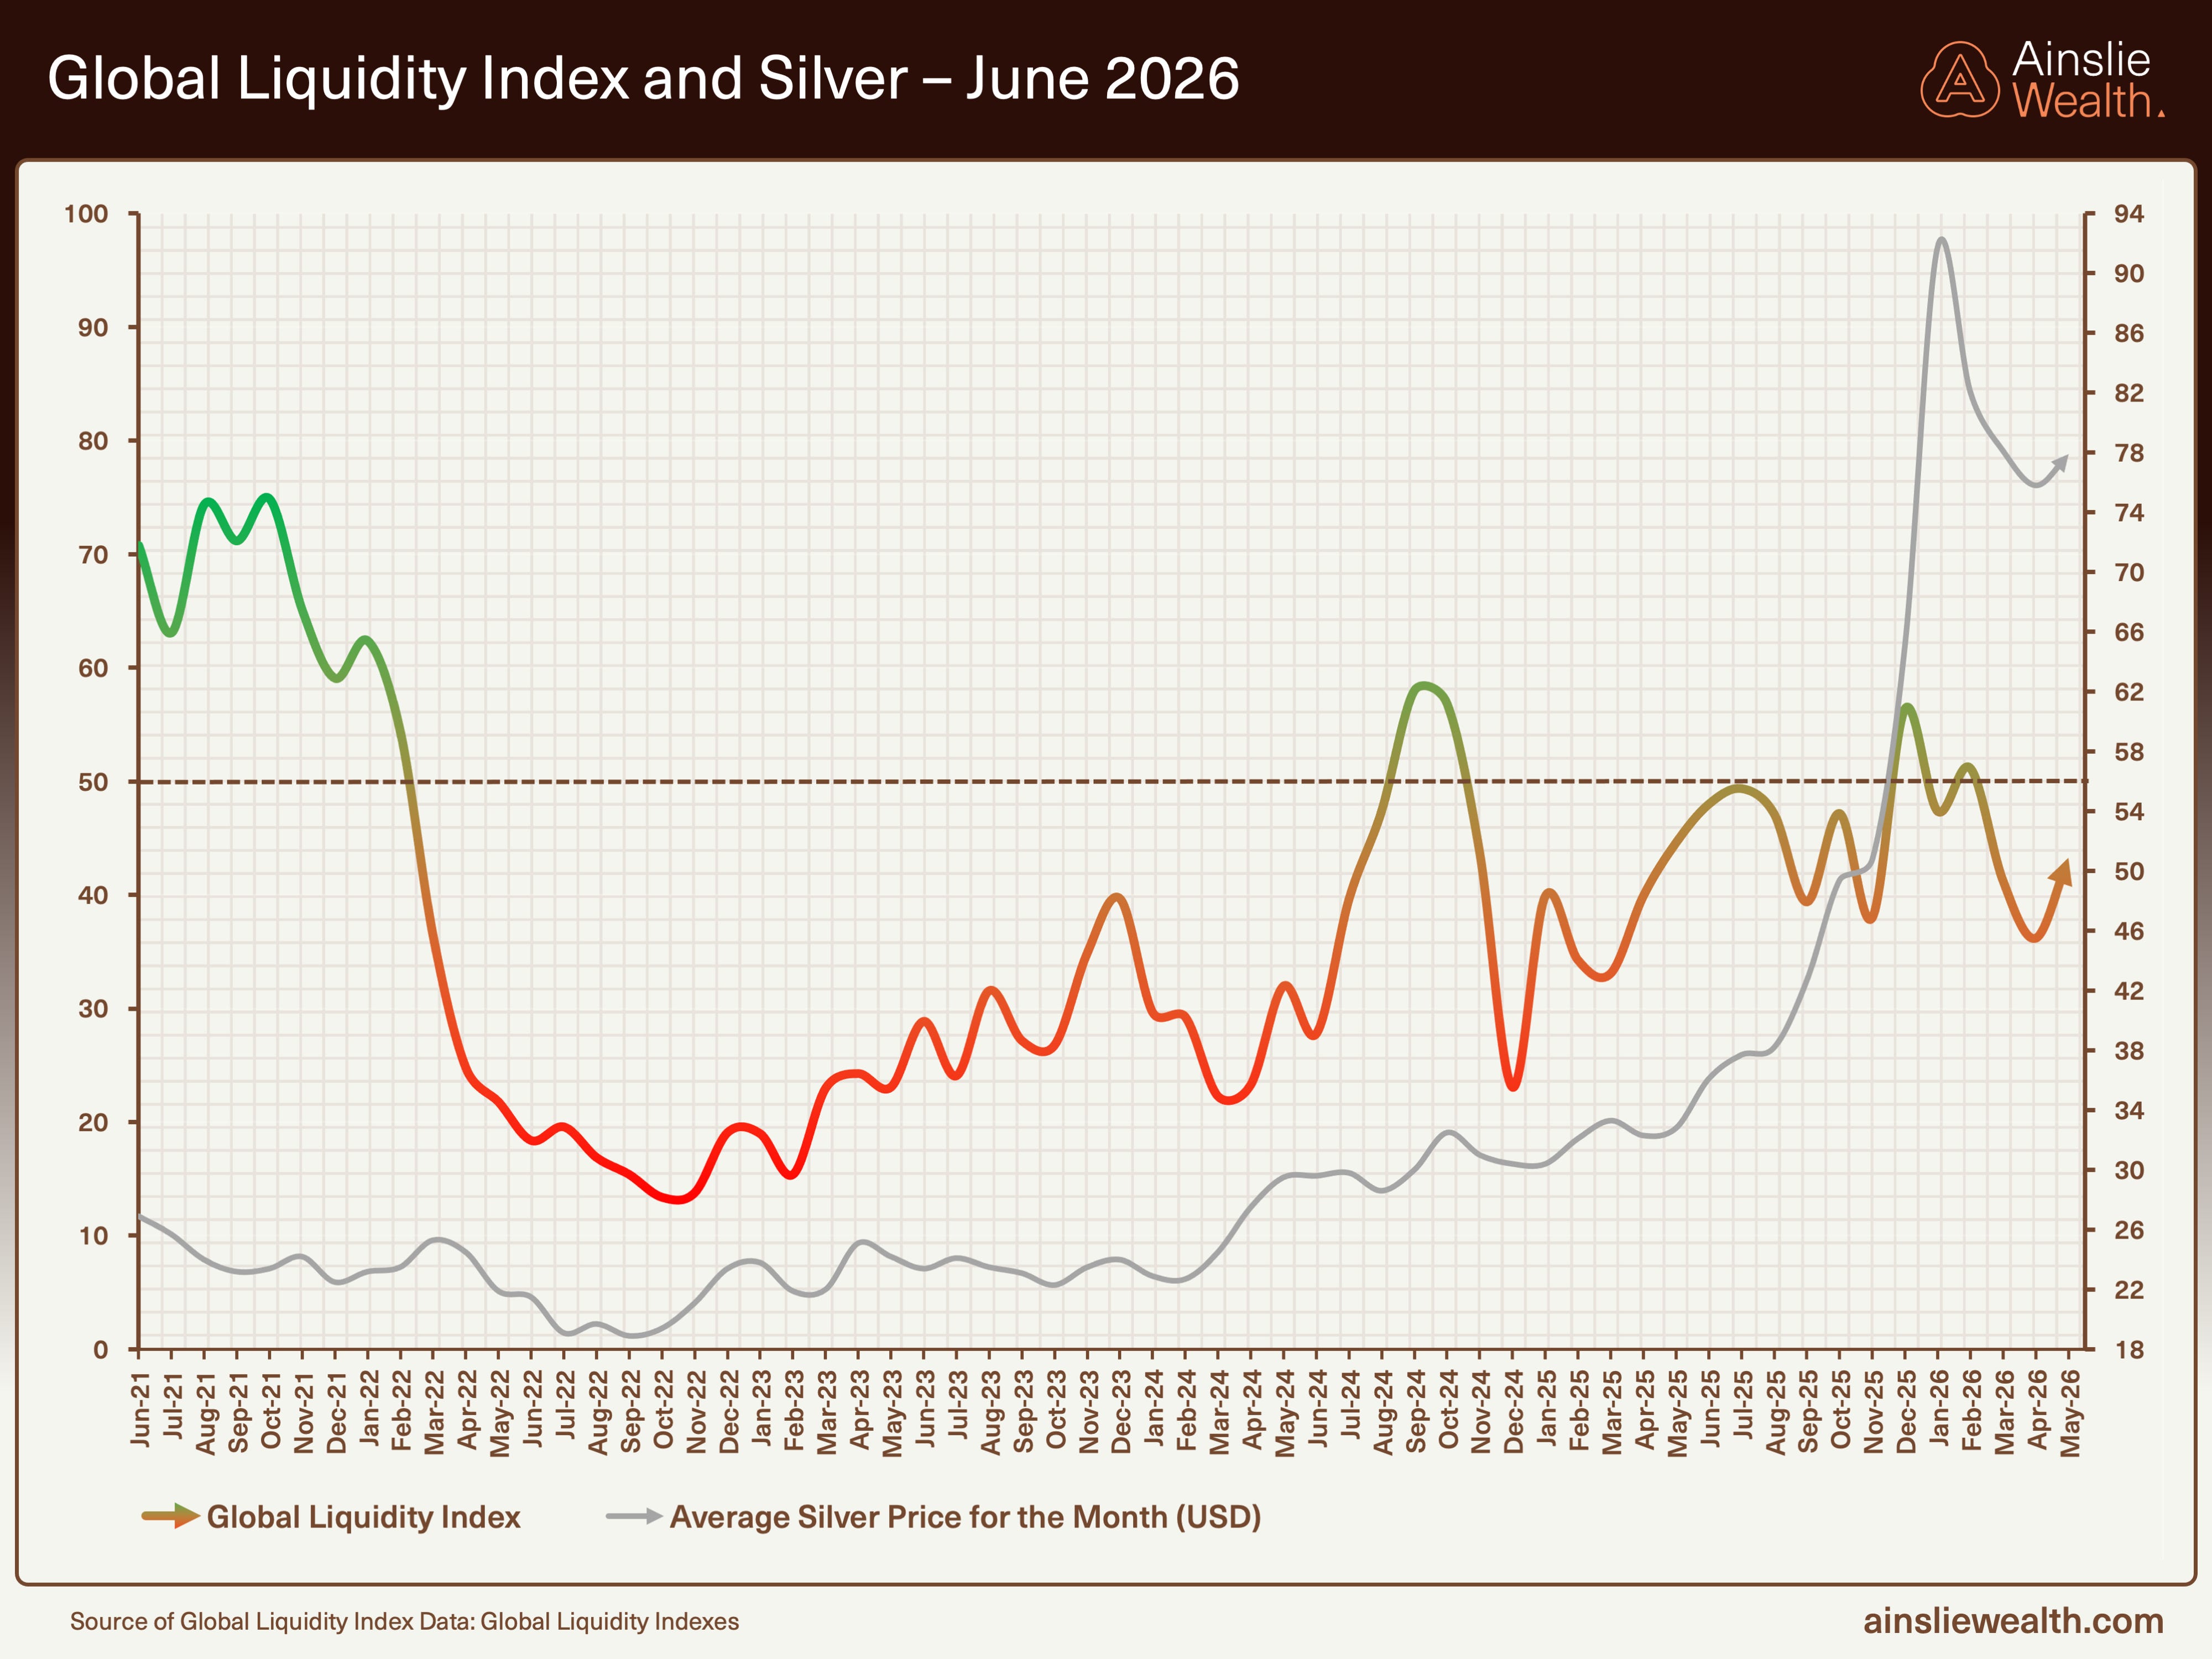
Weekly data show nominal global liquidity climbing to a new high, driven primarily by People’s Bank of China activity alongside deliberately low bond volatility and firm collateral values that boost the multiplier. This short-term arithmetic lift aligns with the active holding we track. The monthly Global Liquidity Index, however, underscores the structural rollover as growth and capex demands divert balance-sheet capacity from financial reflexivity. The East-West split is stark, with Asian strength offsetting tightening signals elsewhere.
The Divergence
Bitcoin continues to diverge from the nominal liquidity expansion, illustrating that the floor is real while new impulse remains absent.
The overlay highlights how recent supportive moves have not produced reflexive participation in risk assets most sensitive to liquidity, consistent with the framework’s distinction between the static pool and its movement.
Macro Drivers
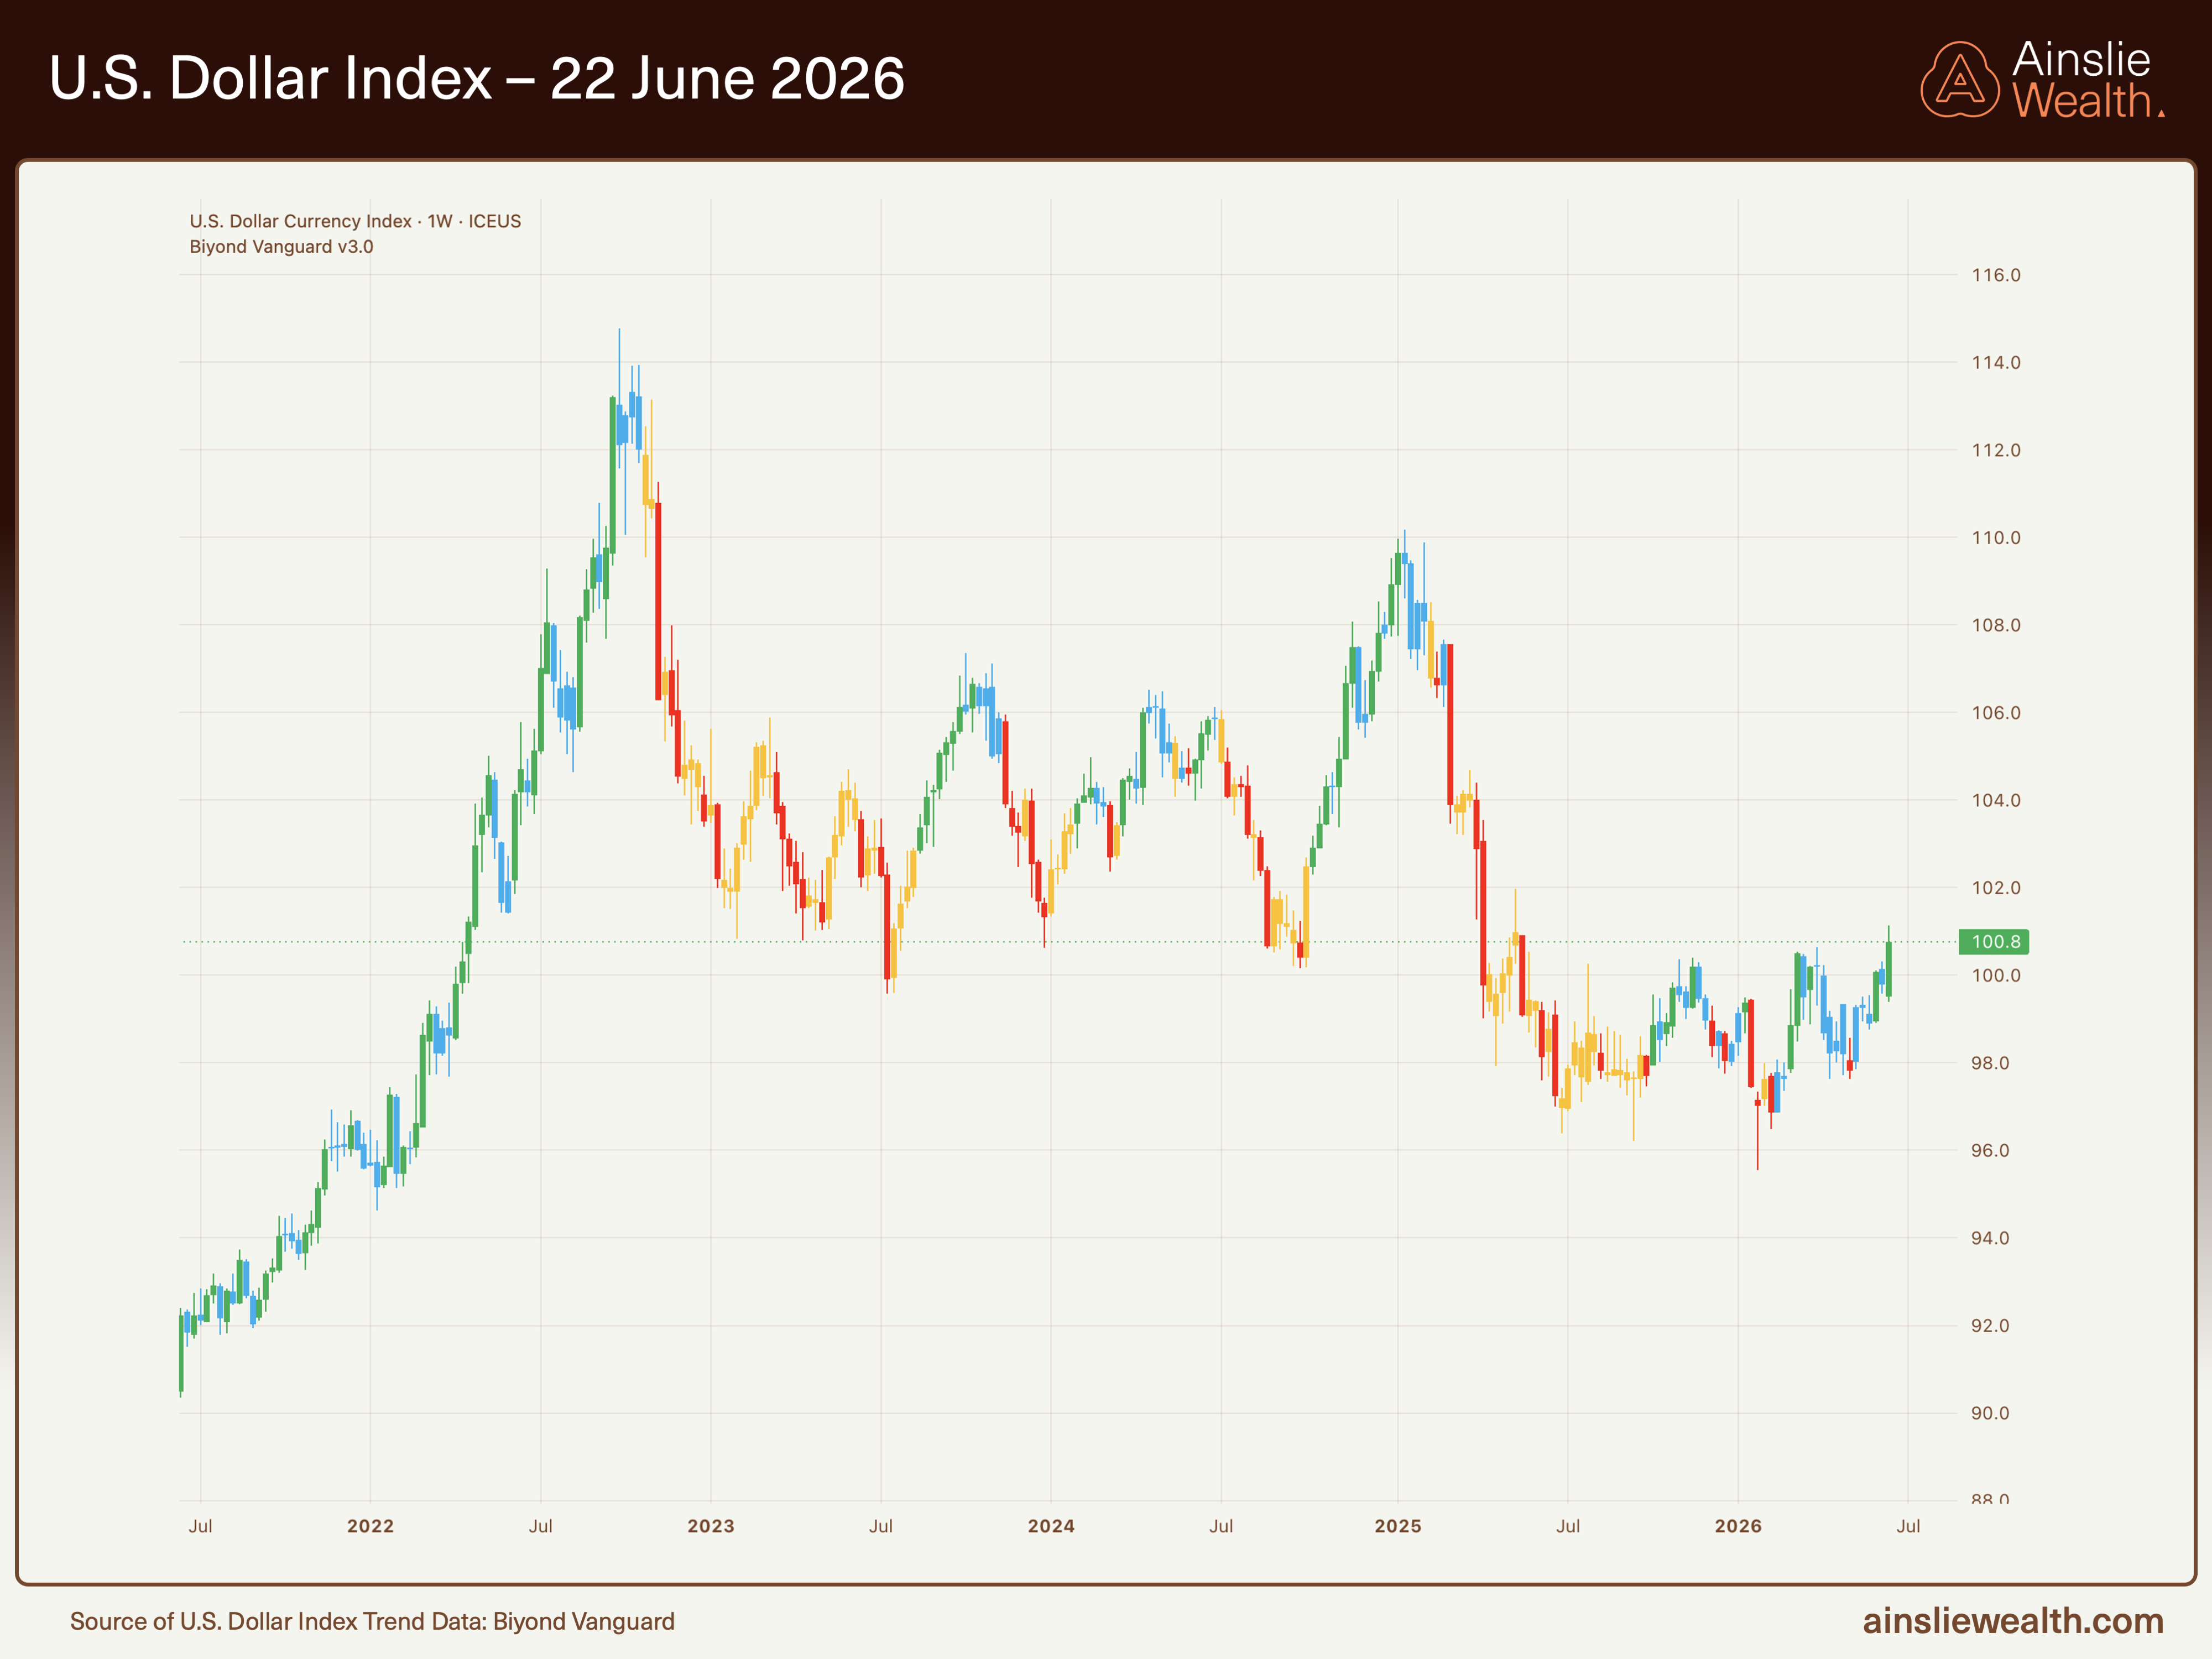
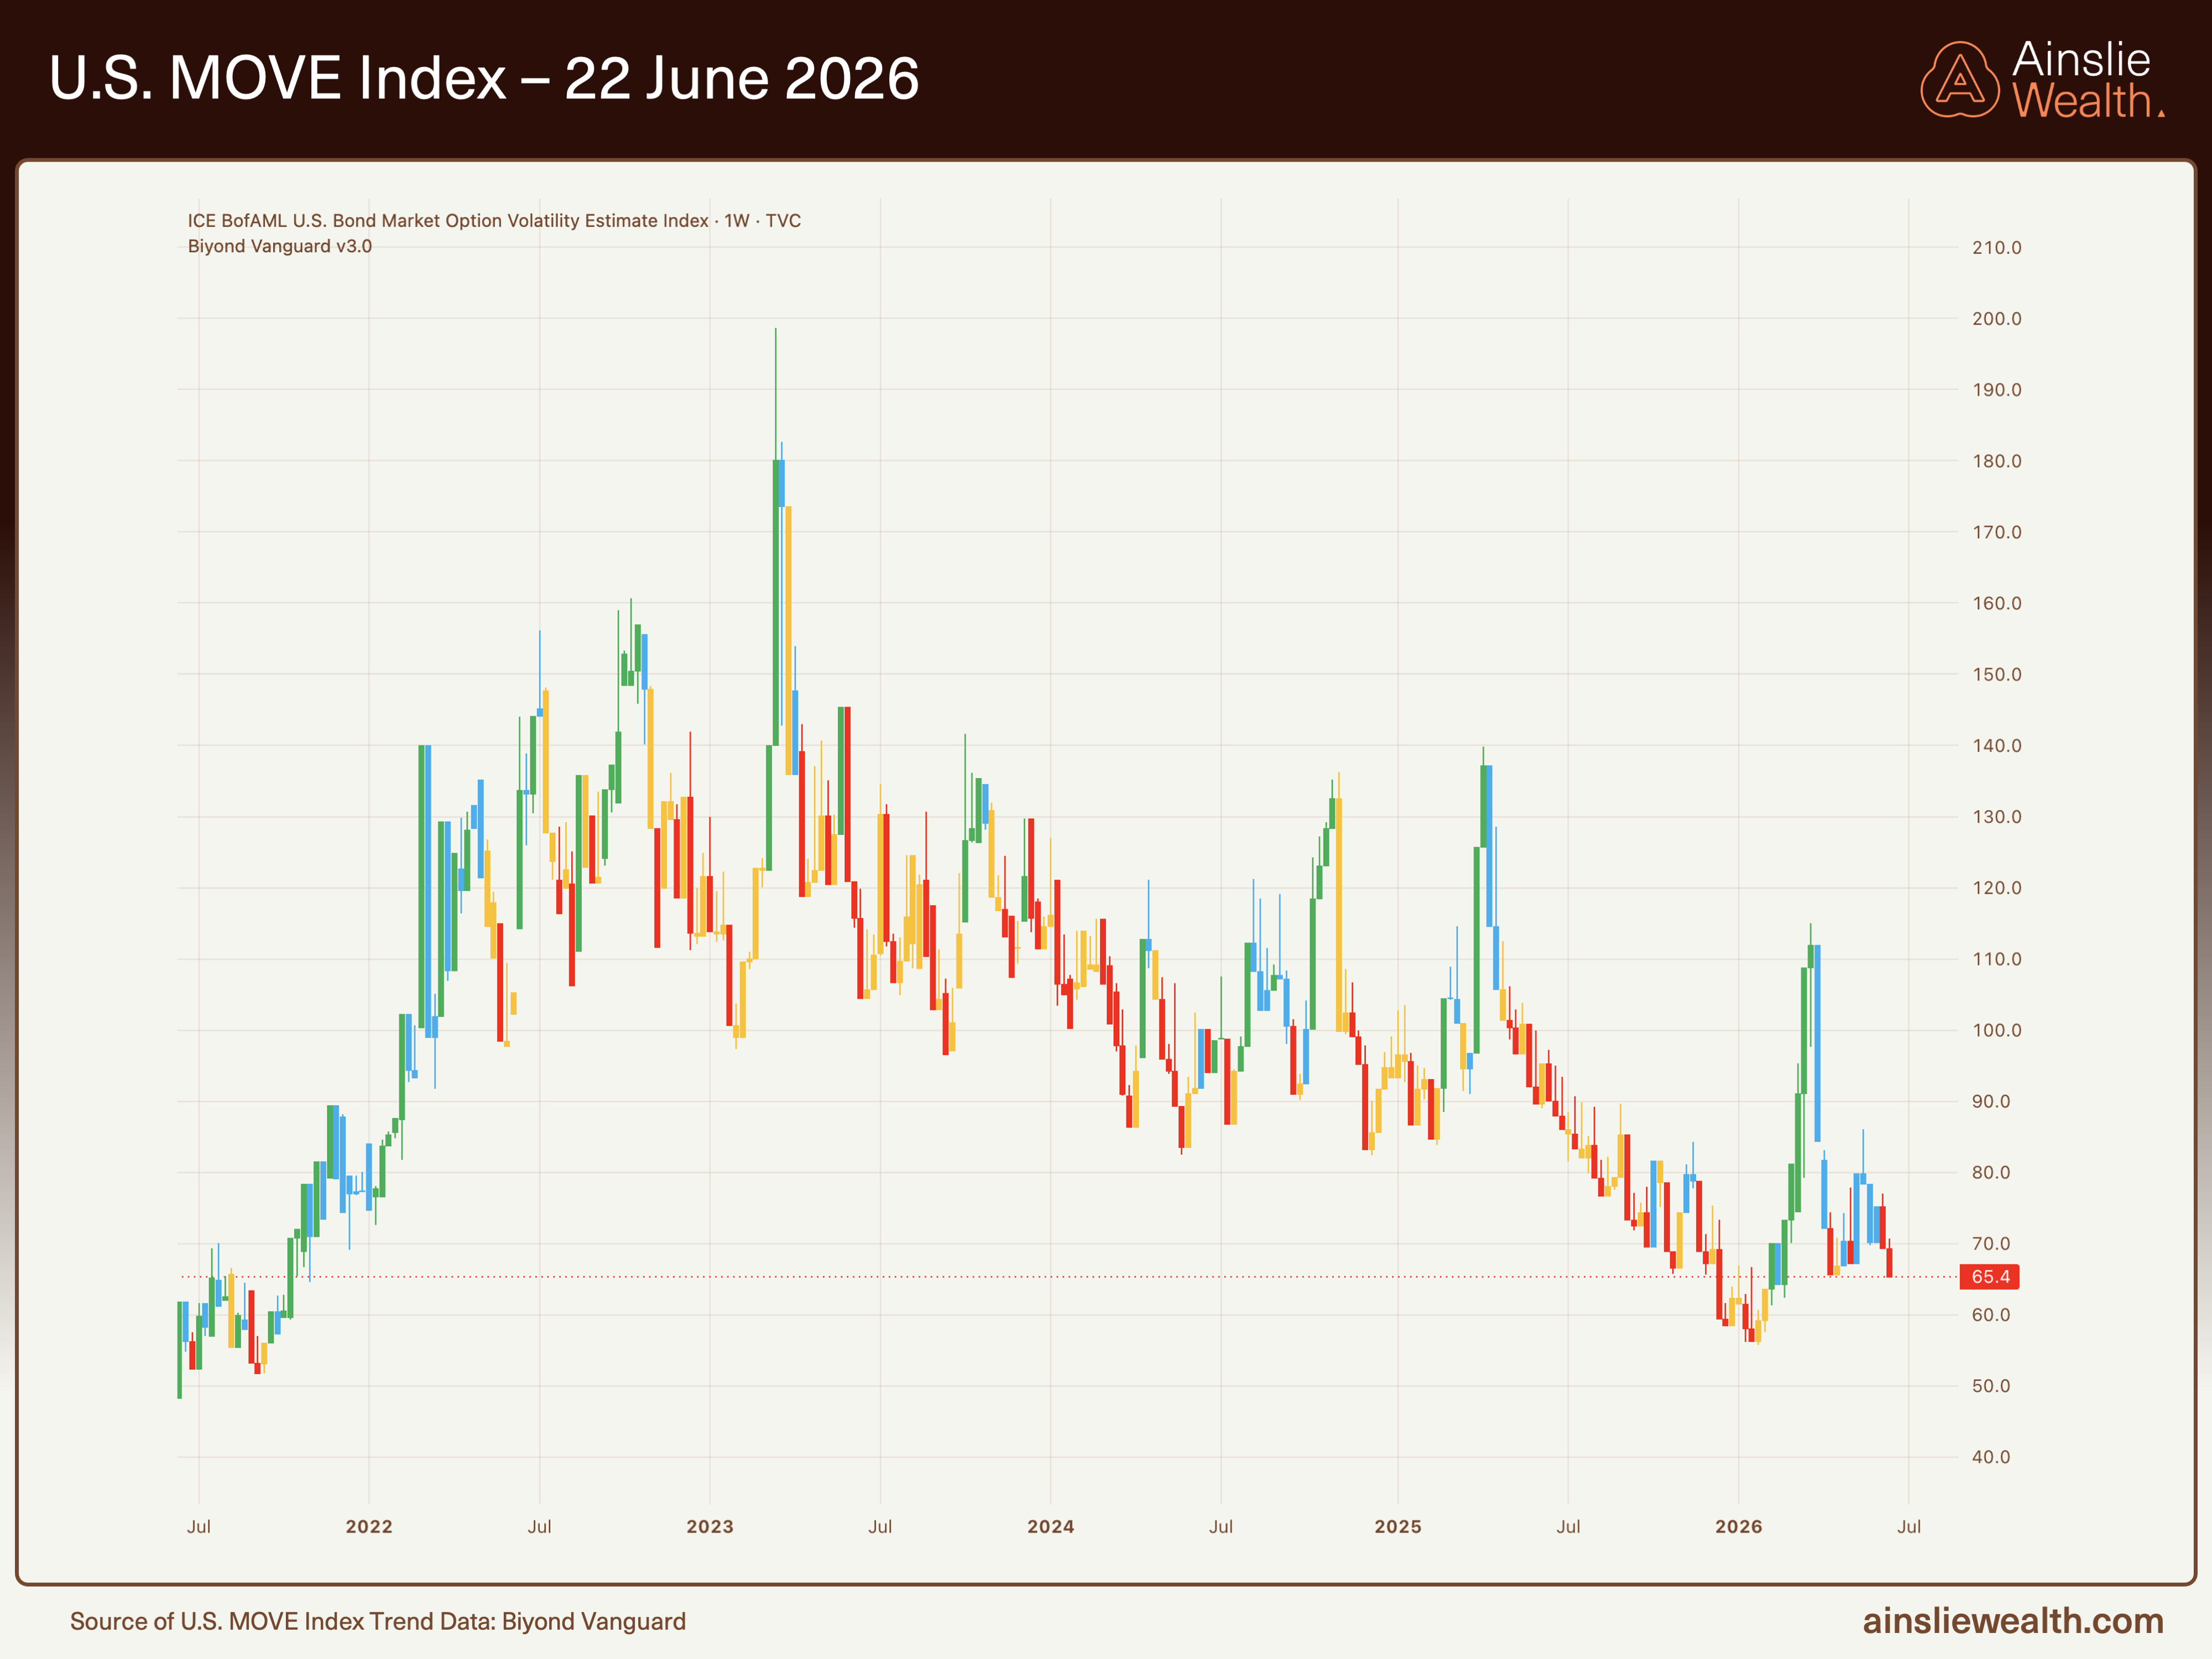
The dollar has faced downside risks while bond volatility remains unusually suppressed, allowing plumbing tools to exert outsized influence on collateral transmission.
The dollar index is pushing higher, but overall continues its relatively softer path amid monetisation scale. At the same time the MOVE Index – the bond market’s equivalent of the VIX for stocks – has declined sharply, reflecting deliberate volatility management that reduces haircuts and supports the collateral multiplier. The MOVE Index is the measure of expected bond volatility. This low-volatility backdrop explains the nominal resilience even as cyclical forces build.
Under the Hood
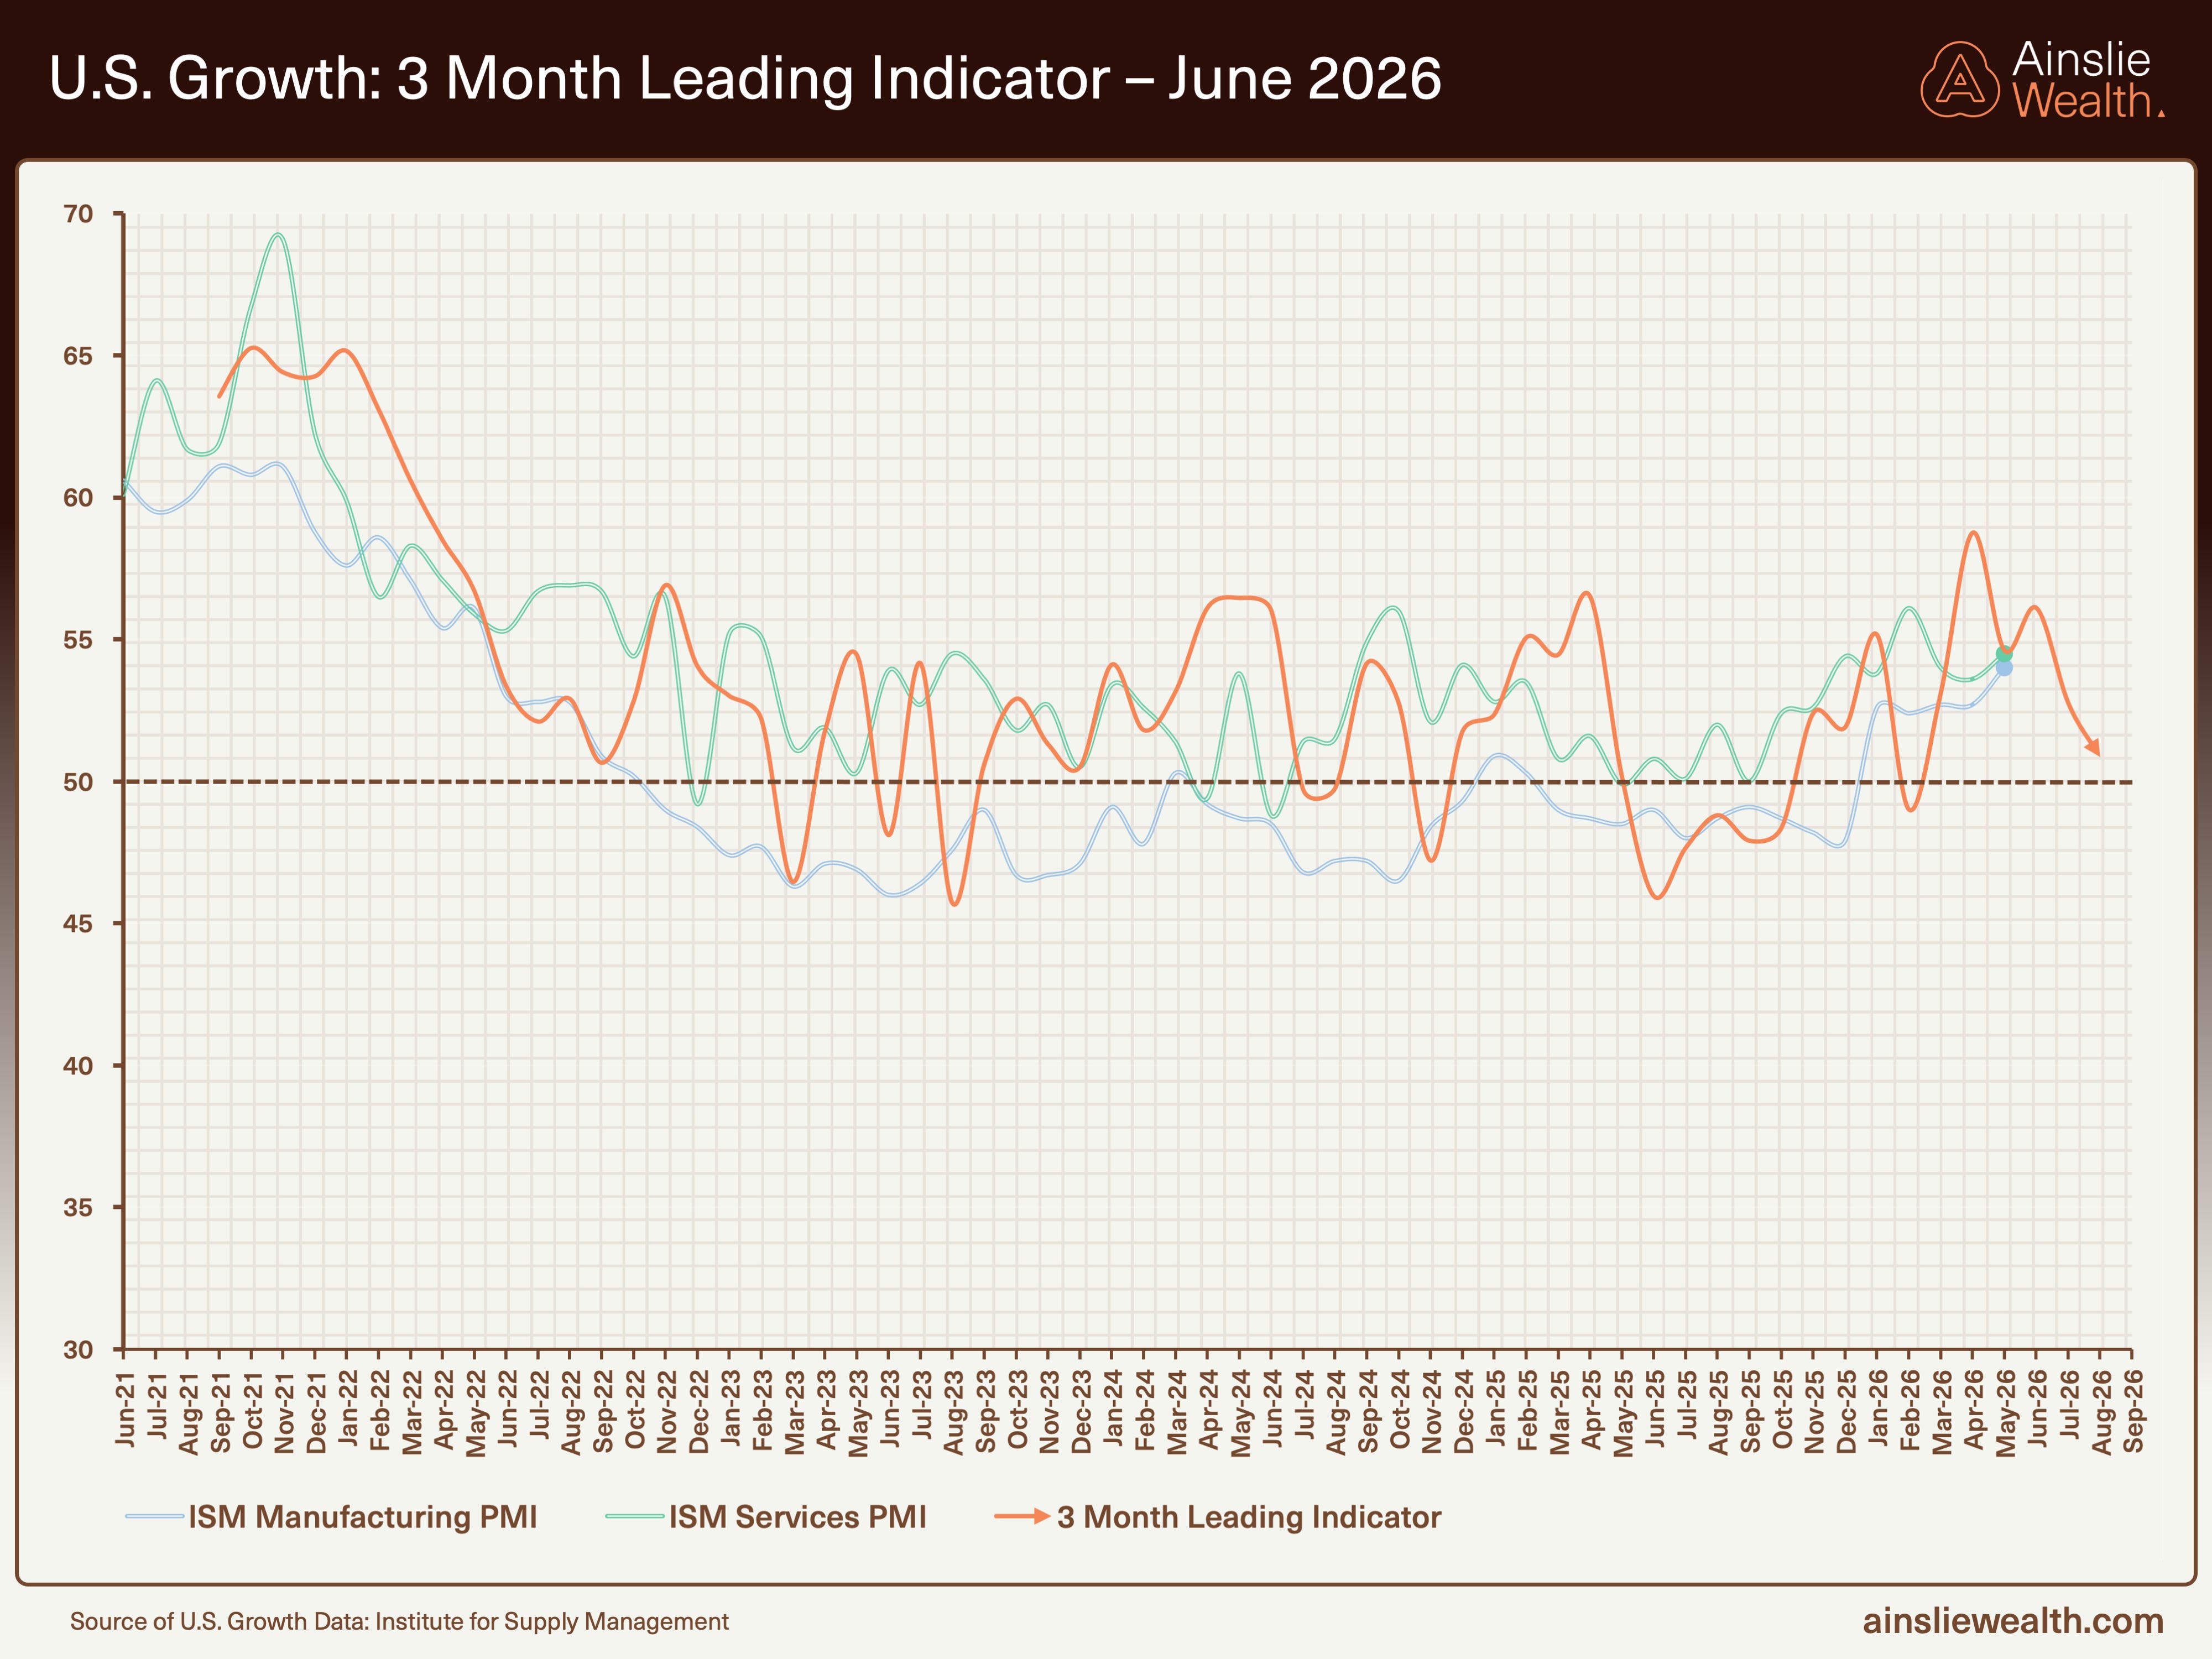
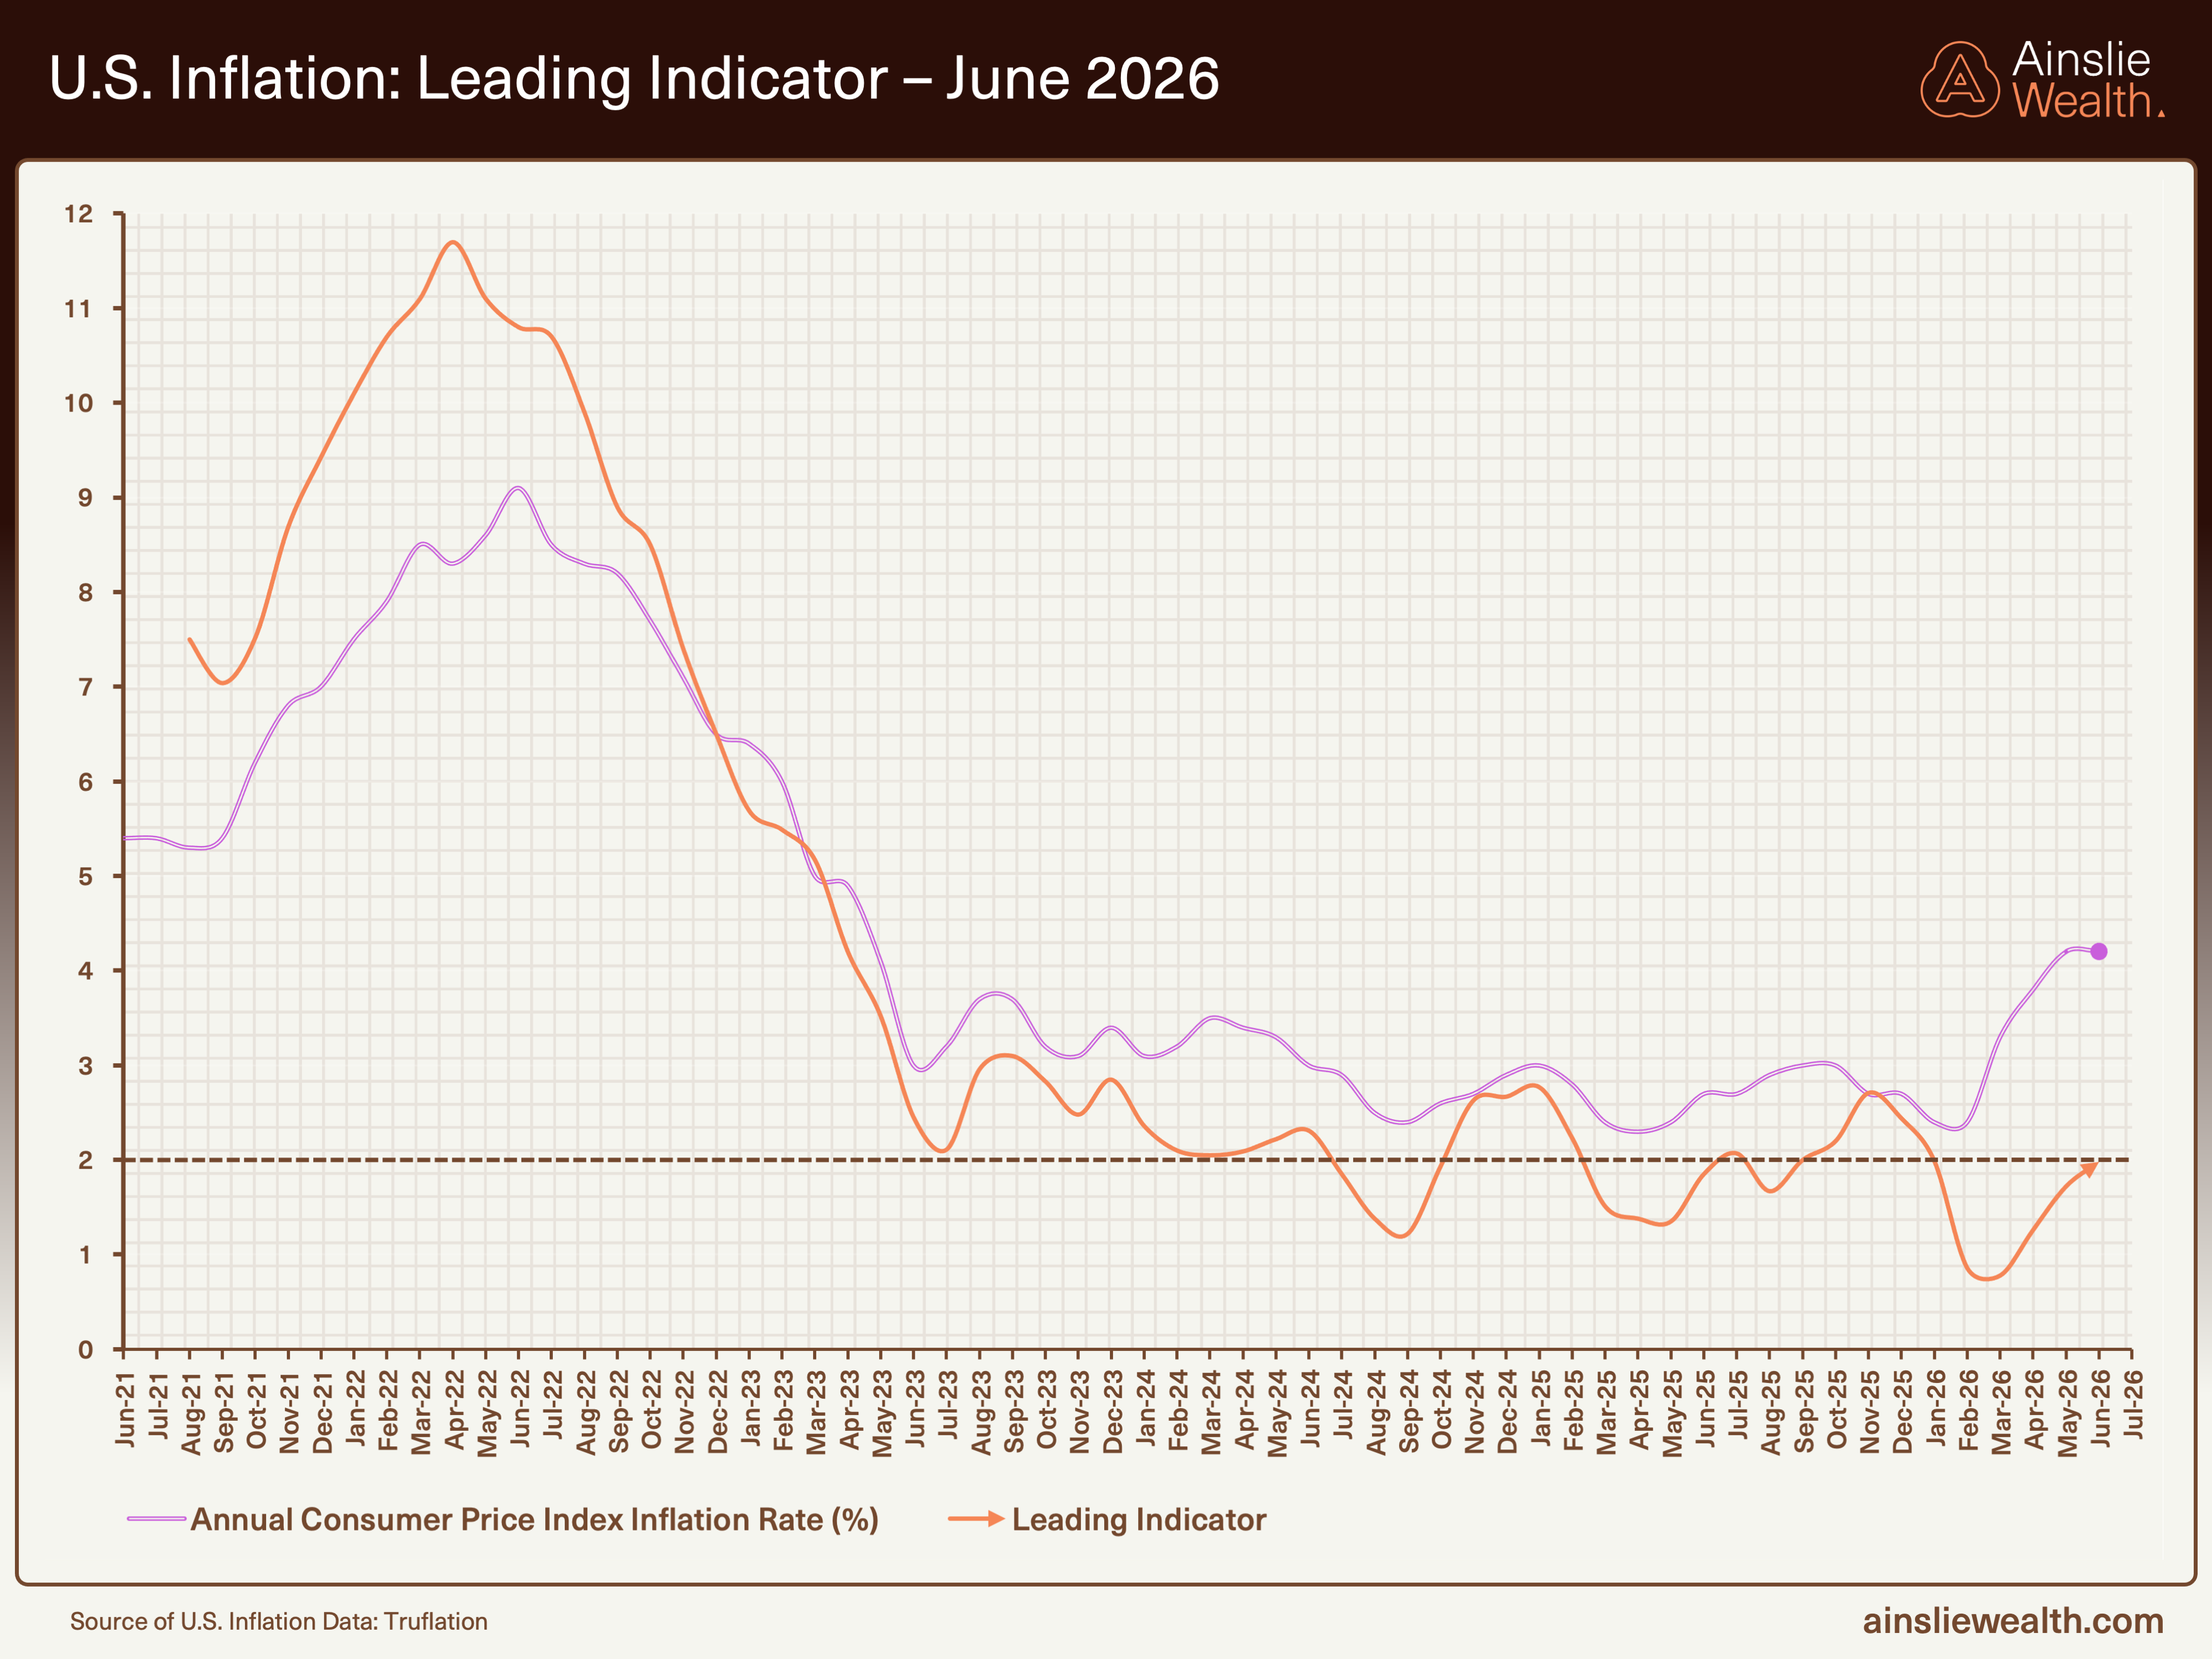
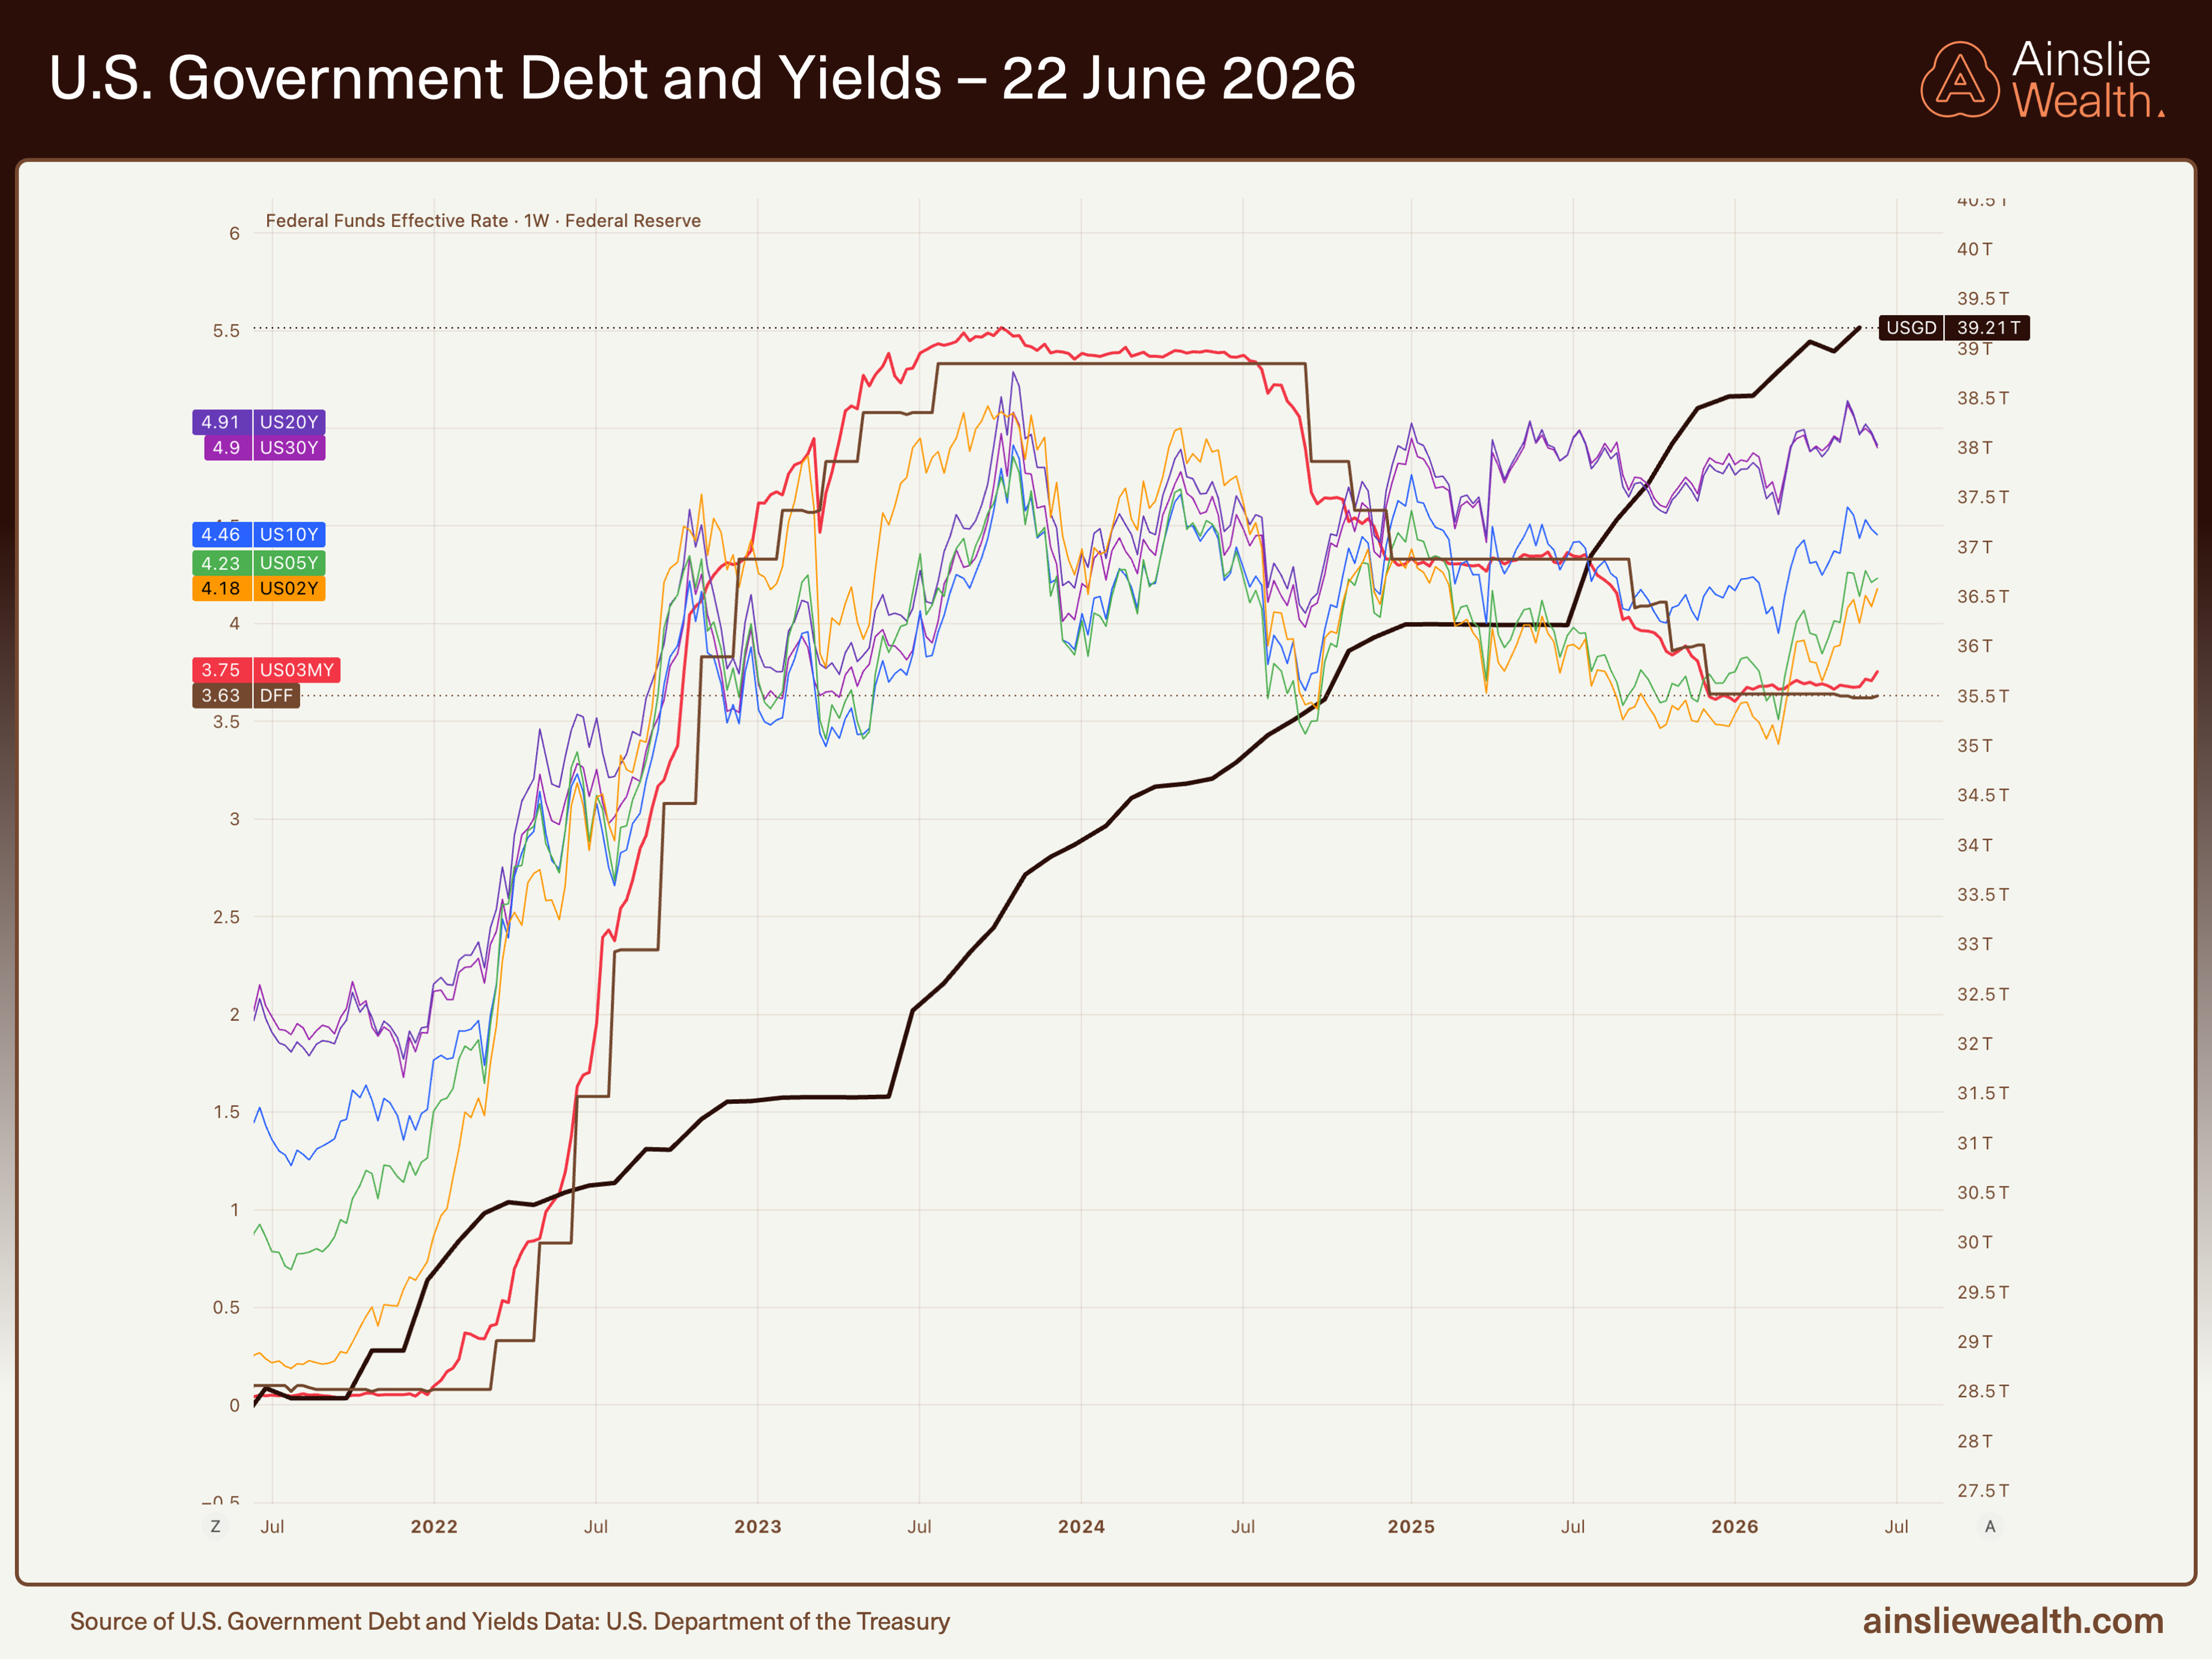
US data reveal a robust real economy successfully absorbing capital while inflation pressures create genuine policy tension.
Growth leading indicators remain in expansion as the broader business sector claims liquidity that previously amplified financial markets. Inflation measures show the interplay of cyclical forces and longer-term disinflationary trends from technology and productive absorption. Debt levels and yield dynamics confirm the environment where long-end yields face upward pressure.
The View Ahead
The cycle remains late in the speculation phase with turbulence the expected next regime. Recent nominal support from plumbing and selective injections buys time without altering the destination. Monitor the bond-market hinge, any Chinese policy resolution, and signs of re-steepening that would challenge the late-cycle call.
Support is real. A new cycle is not. Position for the structure. Watch Kevin Warsh’s stance and the collateral channel closely.
Reference: Core Thesis
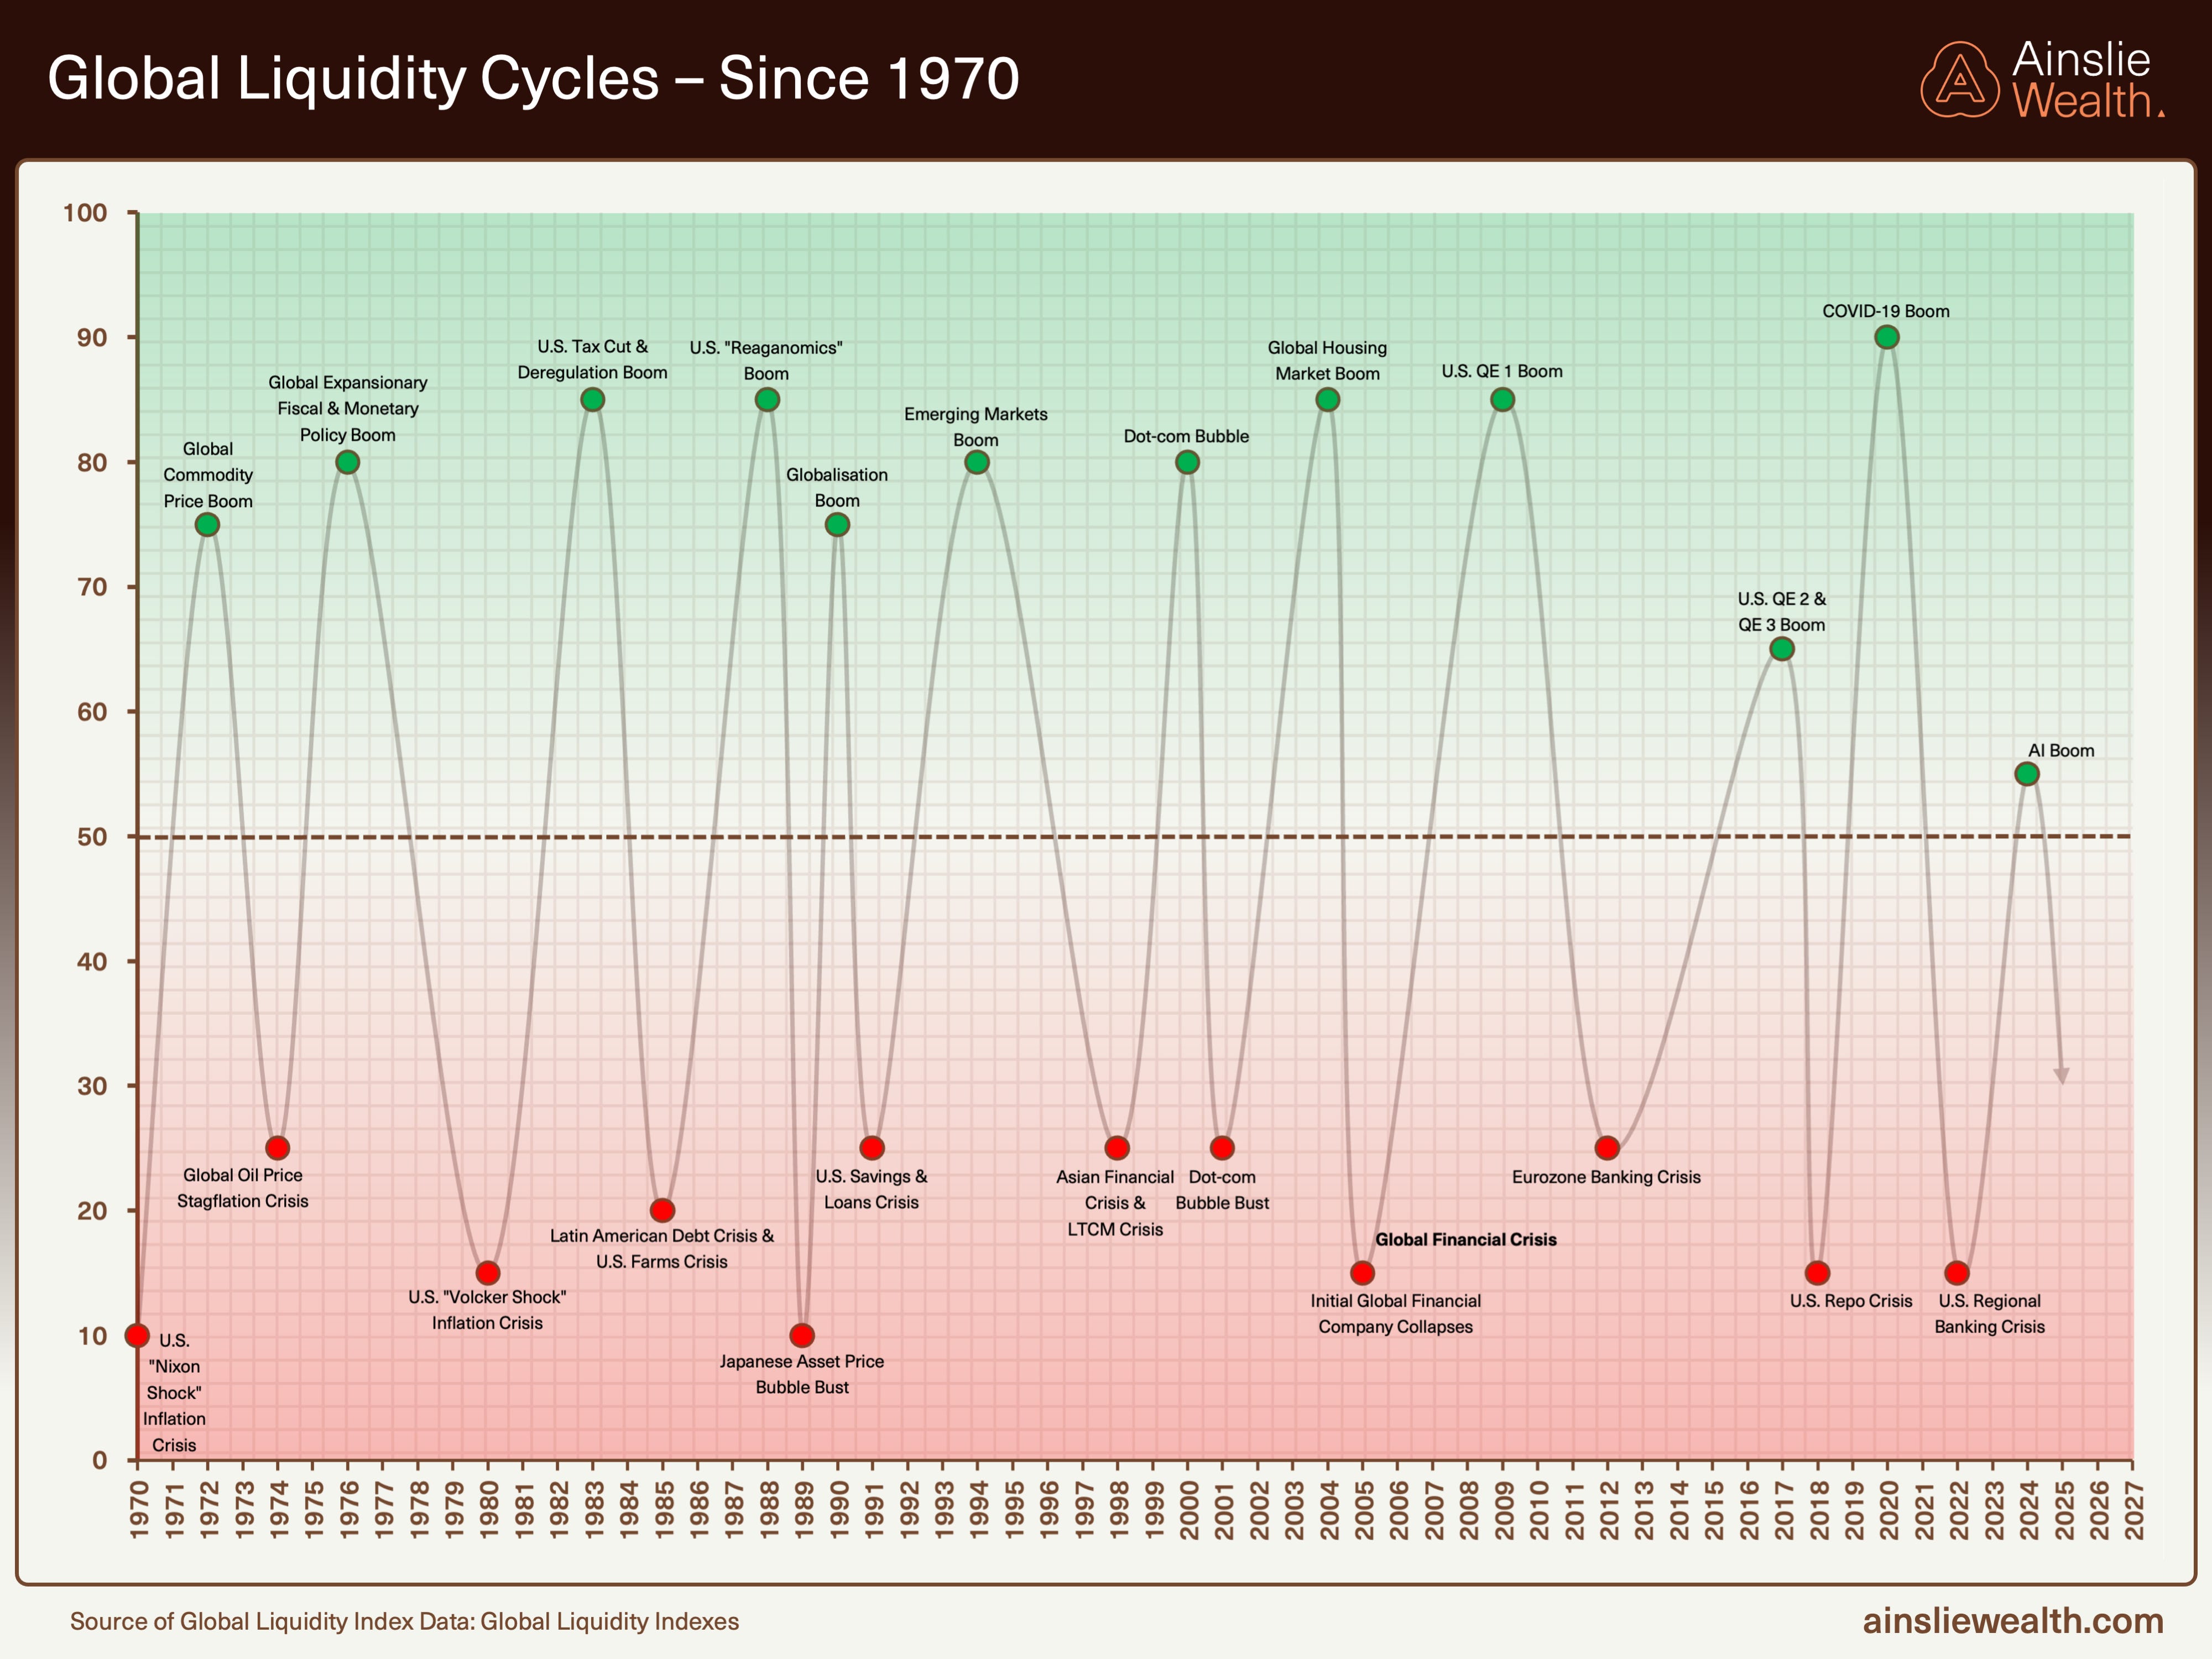
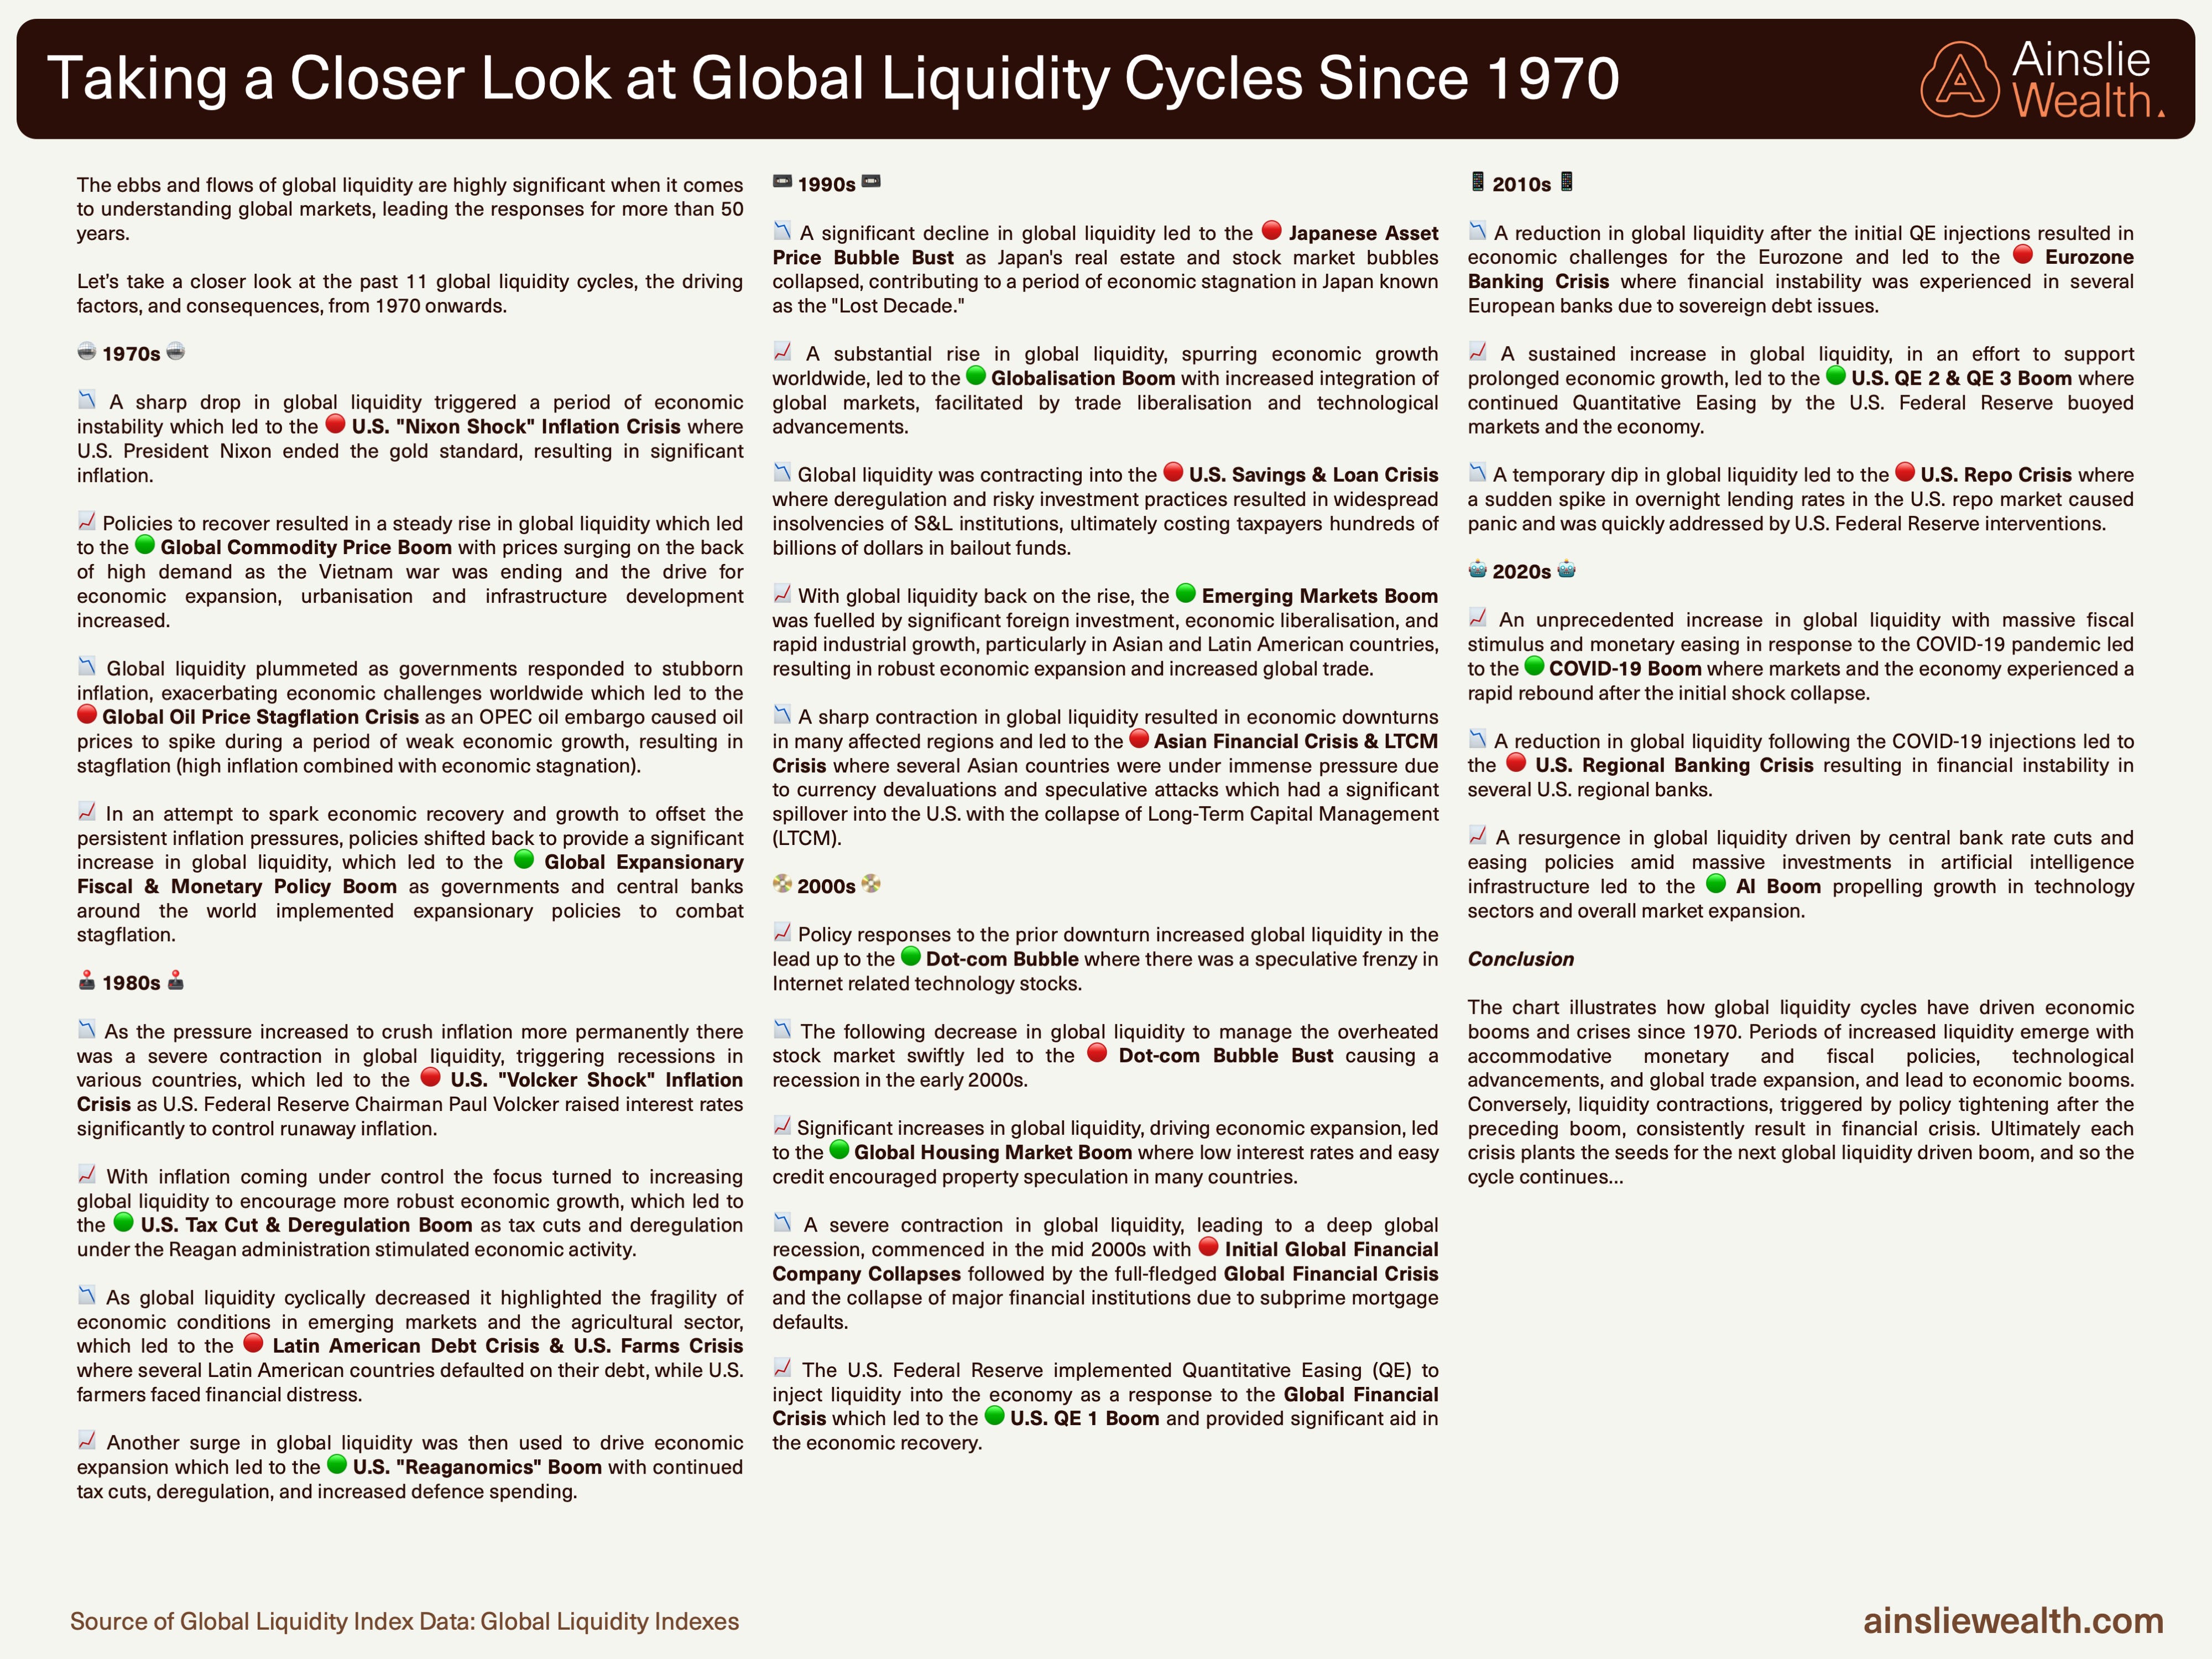
Global liquidity sits at structural highs. Momentum does not. Floor without impulse. The nominal pool still supports risk assets, but the rate of change has turned decisively lower, with a projected trough into late 2027. What matters for pricing is not the pool but its movement.
The cause is not central bank tightening. Headline easing has reached its ceiling, with policy reversals in Japan and Australia marking the limit. Beneath it, the plumbing is being actively held up. The Fed and Treasury have together injected roughly $600 billion into money markets since October: $217 billion through Reserve Management Purchases, the balance from eSLR reform and buybacks. Each 10-point rise in MOVE volatility triggers $3 to $4 billion of buybacks. The coupon-to-bill issuance shift compounds this by redirecting duration into bills. Headline stimulus is capped. Plumbing stimulus is not. Its ceiling is inflation, not deficit politics. PCE annualised at 8.3% last month and a Fed 62 months past its 2% target define the binding constraint. The latest data underscores this with Kevin Warsh assuming a harder stance while short-term PBOC injections provide a brief arithmetic lift amid the broader rollover.
The drain is happening elsewhere. The real economy is absorbing capital at scales previously impossible, principally working-capital demand across the broader business sector. Hyperscaler capex and AI infrastructure are the visible edge; energy costs and resilient growth compound the pull. PMI orders-less-inventories is rising. Cross-asset growth proxies have rebounded cleanly off the Iran dent. Equity internals say the world economy is materially stronger than consensus suggests. Stronger economies pull liquidity out of financial markets. The squeeze comes from the real economy succeeding, not failing. Private balance sheets absorb energy that previously amplified financial reflexivity, leaving a static floor with no propulsive force above. Capex booms are inflationary, as evidenced by recent IPOs and firm US data.
Geopolitical disruption is a latent channel, not active pressure. Iran reads as distraction rather than disaster. The mechanism remains live: each $10/bbl rise drains roughly 1.5 points from the GLI. Dormant until something changes.
We are in the speculation phase, with turbulence ahead. Commodity outperformance, bear-flattening curves and defensive rotation are the active signatures. Bond markets confirm rather than contradict: rising yields reflect higher terminal policy rates, not term premia, which have fallen as demand for safe assets rises. Bear flattening is the regime signature. Re-steepening would invalidate the late-cycle call. Ten-year yields testing 5% looks the path of least resistance; dollar risks have rotated to the downside as monetisation scale grows.
The bifurcation has turned ambiguous on China’s side. PBoC net injections have restarted sharply this week driving weekly figures higher, yet year-on-year now on the verge of contraction, a clean break from the structural-easing pattern. Whether this is geopolitical theatre ahead of further U.S. trade talks, a deliberate yuan-strengthening trade, or genuine policy inflection is unresolved. Chinese bond term premia have inverted in confirmation. Yuan-gold tested 35,000 RMB/oz and has retraced toward the 30,000 floor; a break below would invalidate the structural easing call. Western central banks continue accumulating gold as neutral reserve collateral amid widening sovereign credit uncertainty. Gold remains hostage to the bond-market hinge: when bonds flip from inflation discipline to credibility fracture, gold reprices sharply higher. Silver follows as hybrid constraint, with the structural case deepening while the market refuses to price it.
Bitcoin’s weakness reflects recalibration, not thesis failure. Liquidity models capture near-term headwinds but miss structural supply compression and sovereign demand for settlement neutrality. Structure governs destination; reflexivity governs route. Accumulation through weakness remains consistent.
Positioning: cautious on duration and credit at the front, constructive on commodities and energy, selective extension toward the five-year as bear flattening progresses. Monetary hedges accumulated as function over promise. Liquidity informs timing; trust repricing dictates allocation.
Appendix Charts
Disclaimer
The information in this report is current as at the date and time of preparation. This report is intended to be used for general informational purposes. It contains general buy/sell recommendations for Bitcoin and Bullion which do not take into account any particular circumstances, objectives or situations. Past performance should not be taken as an indication of future outcomes. You should consider obtaining independent advice before making an investment decision.
We rely on publicly available data, statistics and software from third party sources and our own proprietary analysis to construct the report. We do not warrant the accuracy and completeness of this analysis or the data sourced from third party providers.
Although we exercise care when preparing the report, to the full extent allowed by law, we do not accept any liability at law (including but not limited to under contract, in tort, under statute or otherwise) and fully disclaim any and all liability for loss or damage suffered by you or any other person in connection with the use of the information contained in this report, including any errors or omissions. In no event will we be liable for any special, indirect, incidental, or consequential damages which may be incurred or experienced by a person relying on the contents of this report.
As Chief Economist, I may personally take positions in these markets counter to the general buy/sell recommendations provided, which may or may not be market neutral.